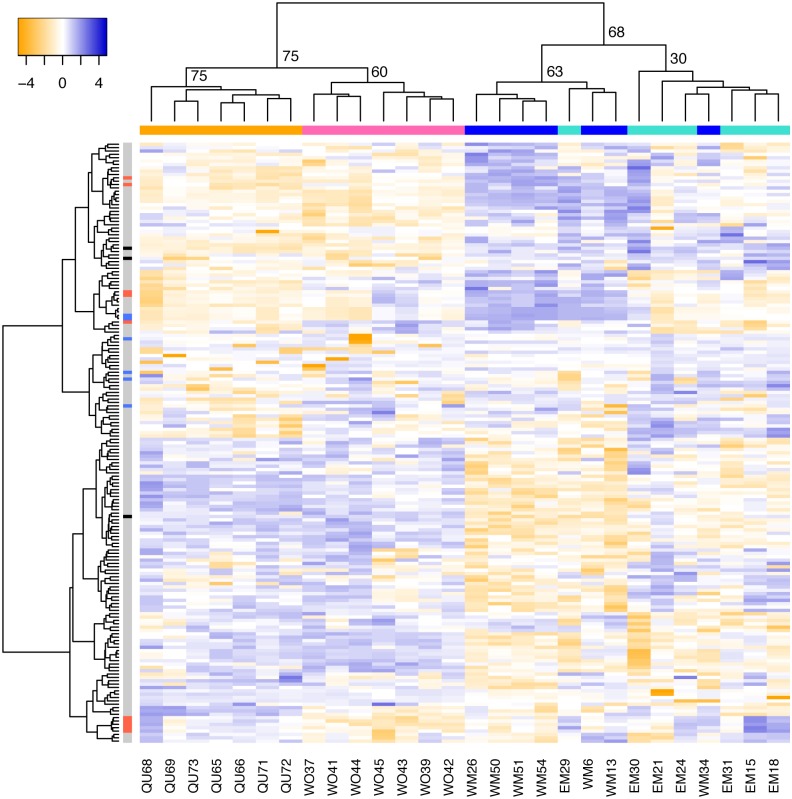
Fig 2. Heat map representing hierarchical clustering of normalized counts for sex-biased exons across the four morphs of the ant Cardiocondyla obscurior.
Females are clustered into the two castes: workers (WO, pink) and queens (QU, orange). Males also cluster into the two morphs: winged males (WM, dark blue) and wingless males (EM, light blue), with the exception of two samples (WM34, EM29). In the heat map, yellow indicates low expression and blue indicates high expression. Columns represent exons that exhibit sex-biased expression. As revealed by principal component analysis (PCA), exons whose loadings fell into the 10% or 90% quantile on PC 1 and either PC 2 (separating female morphs) or PC 4 (separating male morphs) are indicated in red and blue, respectively. dsx exons are highlighted in black (top: exon 7, middle: exon 6, bottom: exon 5). Numbers in the sample-tree show bootstrap values.

