Figure 1.
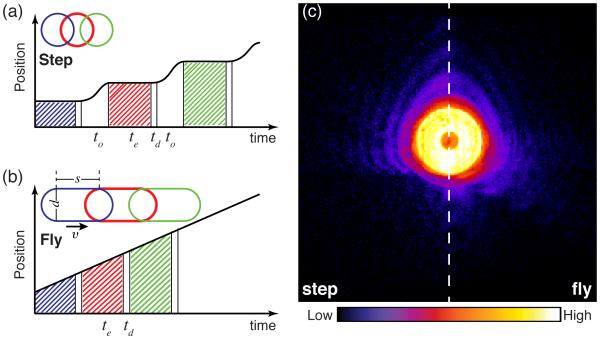
Comparison of step-scan and fly-scan ptychography. In step-scan mode (a), the probe moves relative to the sample in a move-settle-acquire sequence, where the detector doesn’t acquire data during the move-settle overhead time to; then the diffraction pattern is collected over an exposure time of te, after which the detector becomes inactive for a dead time td for data transfer. In fly-scan mode (b), the probe moves relative to the sample in a scan line with a constant speed while data is acquired over exposure times te followed by brief detector dead times td. Insets show both step-scan and fly-scan beam footprints (assuming a round probe with a diameter d) with s representing the probe motion distance during exposure time te. (c) The diffraction intensities measured from a gold test sample in the two scan modes with te= 100 ms and s = 100 nm (experimental details are in Sec. 2). Speckle visibility is reduced in fly-scan mode. Figure based on.17

