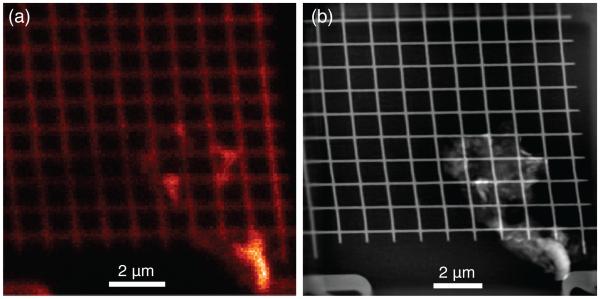
Figure 3.
Simultaneous fly-scan ptychography and fluorescence imaging of a Au test sample. 150 × 150 diffraction patterns were recorded in fly-scan mode with a 5.2 keV focused beam of ~ 85 nm. The fly-scan step size s in continuously moving direction and the step size in the other direction were both kept as 70 nm, yielding a scan region of 10.5 × 10.5 μm. (a) shows the the fluorescence map of Au M-shell, the spatial resolution is limited by the size of the probe beam. (b) Ptychographic image reconstructed from simultaneously acquired diffraction patterns (without position correction). 3 probe modes were used in this reconstruction.

