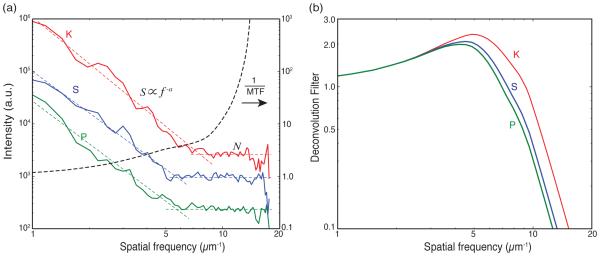
Figure 5.
Deconvolution of fluorescence images with the modulation transfer function (MTF) and a Wiener filter W (fx, fy) put together in a combined deconvolution filter D(fx, fy) of Eq. 4. The fluorescence data from several trace elements (K, S, P) were collected simultaneously with ptychography data while imaging a frozen hydrated green alga11 in an experiment using a Fresnel zone plate with an outermost zone width of 70 nm. (a) Power spectral density of the chemical element images shown along with their respective signal trends |S(fx, fy)| ∝ f−a, and the photon statistics noise floor N for each element. (b) The deconvolution filters D(fx, fy) for the trace elements K, S, P obtained using Eq. 4. The filters have small value at high spatial frequency so that the noise will not be amplified in the deconvolution process.

