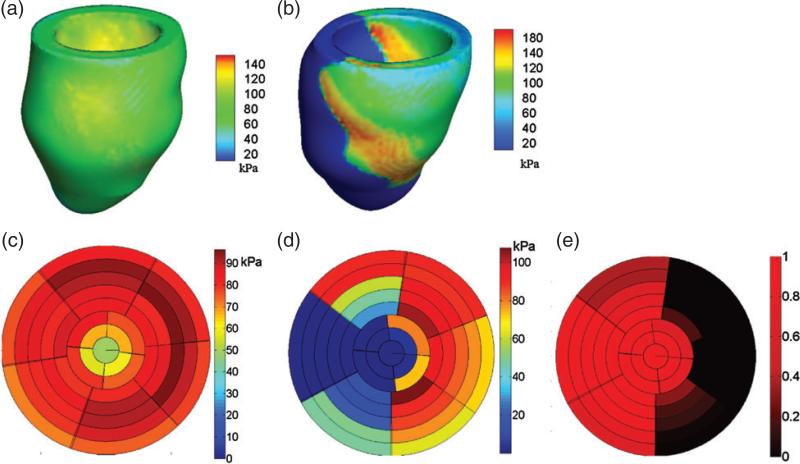
Fig. 8.
Distributions of active tension T at end-systole in the healthy (a) and diseased (b) LV models, regional distributions of T from the base to the apex in the healthy (c) and diseased (d) LV models, and regional distribution of MI extent in the diseased LV model (e). The divisions in (d–f) are defined as in Fig. 3. The rings from outer to inner represent the slices from the base to the apex, and each slice is associated with the volumetric region consisting of the points within 5 mm of that slice plane.

