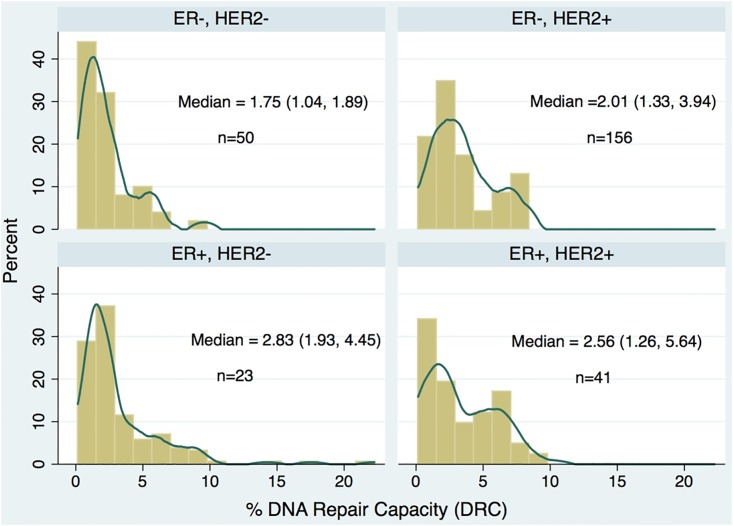
Fig 1. Distribution of levels of % DNA repair capacity (DRC) in 270 women with breast cancer separated in four groups according to estrogen receptor (ER) and HER2 status.
The height of the rectangle denotes the percentage of women with a specific %DRC level. The line denotes the Kernel density estimation (KDE) to show the smoothing distribution of the %DRC. Between parentheses indicates percentile 25 and percentile 75.

