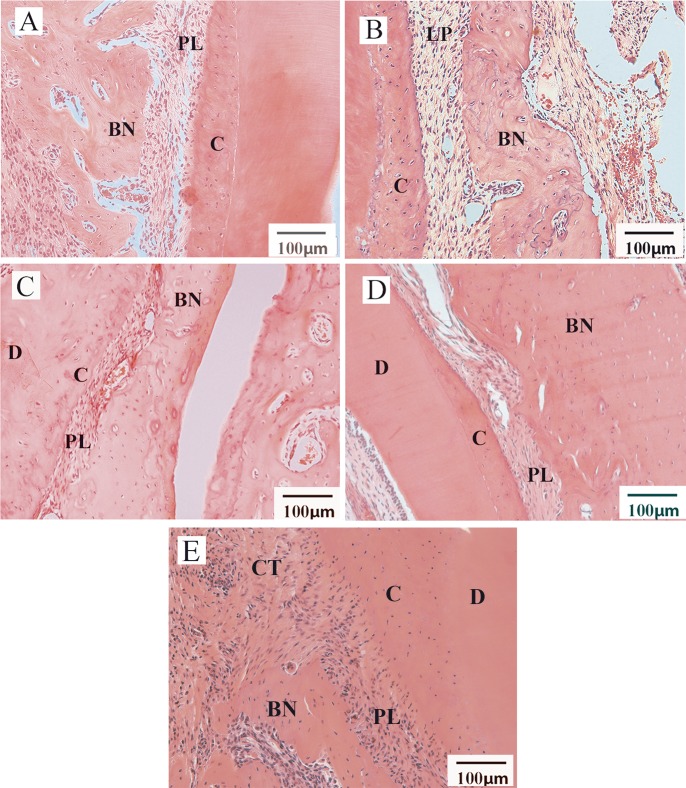
Fig 8. Histological analysis of periodontal defect 30 days after surgery (n = 6 per group).
Image A indicates the use of PLLA/COL/HA membranes. Image B shows PLLA/COL/HA associated with SHEDs. Image C shows PisPLLA/COL/HA membranes. Image D shows PisPLLA/COL/HA membranes associated with SHEDs. Image E indicates the negative control group. New bone formations (BN), periodontal ligament (PL), cementum (C), dentin (D) and conjunctive tissue (CT) are indicated in the figures.

