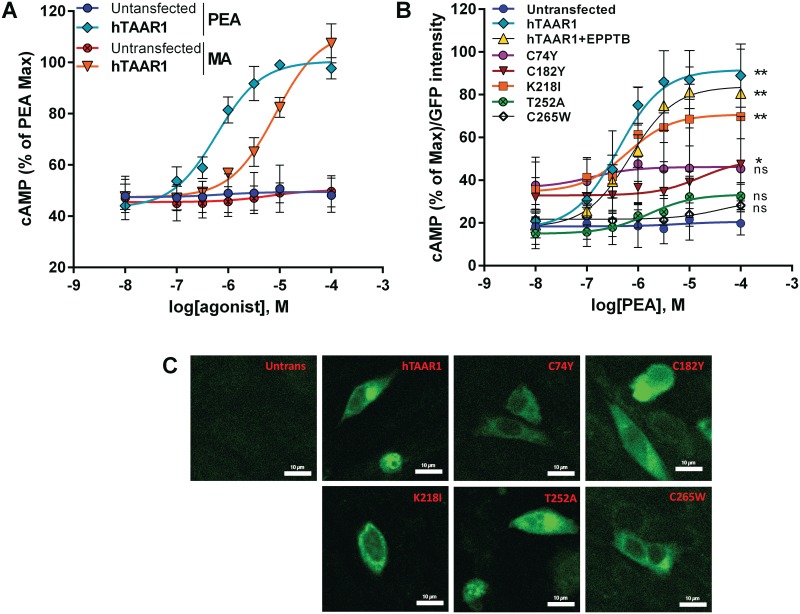
Fig 4. β-PEA and MA stimulate hTAAR1, and hTAAR1 SNPs reduce or eliminate receptor function.
A. β-PEA and MA increased cAMP production in CHO cells expressing the hTAAR1. There was a significant dose × agonist interaction (F (18, 56) = 15.70, p<0.0001. *p < 0.01 for comparison between the indicated group and the untransfected control. +p < 0.01 for comparison between PEA and MA groups. B. β-PEA dose-response curves in untransfected CHO cells and cells expressing the hTAAR1 variants. EPPTB (10 μM) caused a rightward shift in the β-PEA dose-response curve. There was a significant dose × receptor variant interaction (F (42,147) = 3.189; p<0.0001). * p<0.05 comparing C182Y and untransfected control cells; ** p<0.0001. ns = non-significant. Data shown are means ± SEMs from at least three independent experiments, each conducted with duplicate determinations. C. Confocal images of receptor expression in transfected cells.

