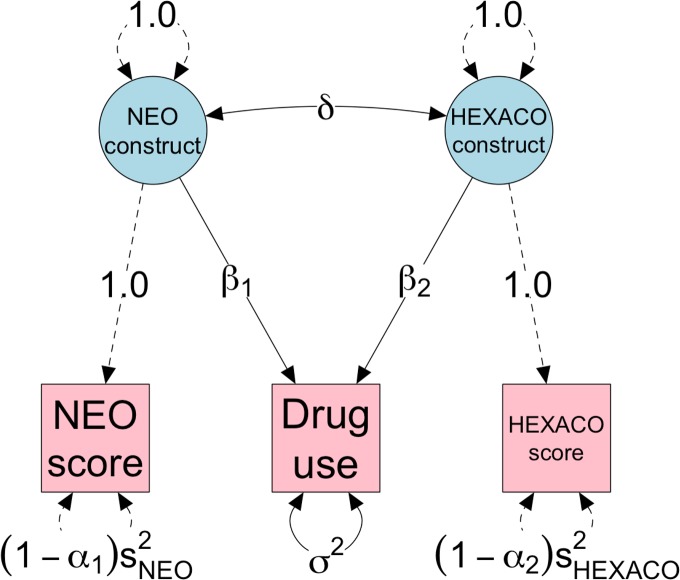
Fig 9. Path diagram for a SEM predicting drug use, allowing for specified degrees of reliability in the observed NEO and HEXACO scores.
Circle nodes represent latent variables, square nodes represent observed variables, solid lines represent paths or variances to be estimated from the data, and dashed lines represent paths or variances that are fixed to constant, a priori values. SEM = Structural Equation Model.

