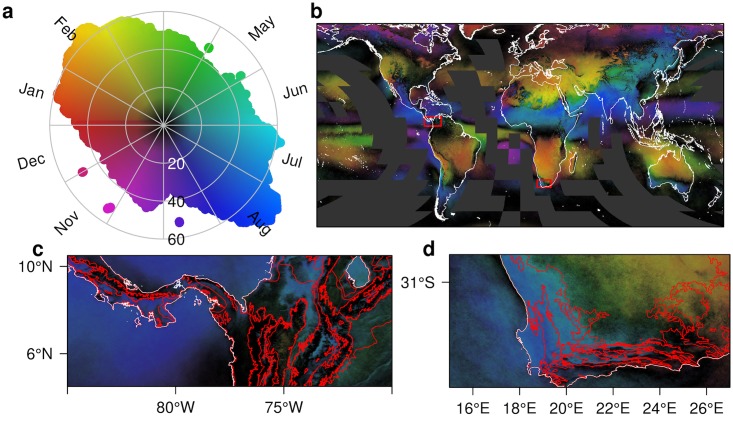
Fig 2. Seasonal cloud concentration.
A. Color key illustrating the distribution of global cloud seasonality and concentration. The hue indicates the month of peak cloudiness, while the saturation and value indicate the magnitude of the concentration ranging from 0 (black, all months are equally cloudy) to 100 (all clouds are observed in a single month). B. Global distribution of seasonal cloud concentration with two red boxes indicating the locations of panels C and D. Coastlines shown in white, areas with no data are dark grey. C. Regional plot of northern South America illustrating the transition from June–July–August to December–January–February cloudiness with little seasonality (dark colors) at high elevations. D. Regional plot of southern Africa illustrating the transition from the Mediterranean climate in the southwest to the summer rainfall region in the northeast. Note the incursions of summer clouds and associated rainfall (red colors) along the southern coast. In C and D, red lines indicate ecoregion boundaries [35]. For further exploration see http://www.earthenv.org/cloud and for download see http://doi.org/10.6084/m9.figshare.1531955.

