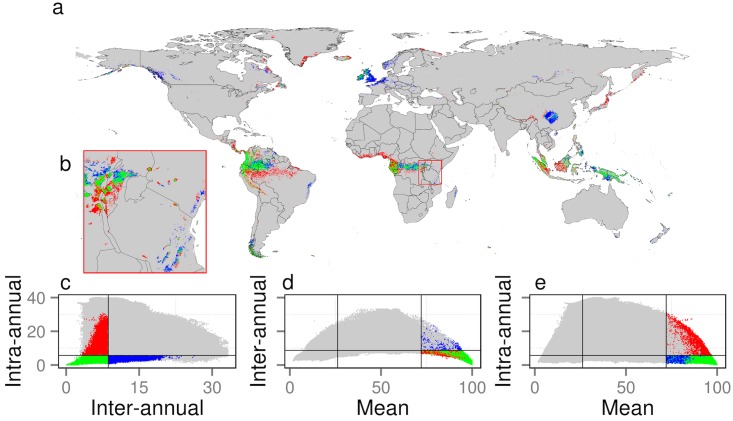
Fig 3. Global hotspots of temporal cloud cover constancy.
A. Geographic locations of minima in cloud dynamics using colors defined in C–E. B. Inset showing detail (red square in A) over East African Biodiversity Hotspots. C–E. Scatterplot of pixels in A and B, which serves as a color key to the map. Colored pixels indicate locations in the top 10% quantile of mean annual cloud frequency (see D and E) and bottom 10% quantile of intra-annual cloud variability (blues), inter-annual cloud variability (reds), or both (greens). Lines in scatterplot indicate the 10th (and 90th for mean annual) percentiles. For further exploration see http://www.earthenv.org/cloud and for download see http://doi.org/10.6084/m9.figshare.1531955.

