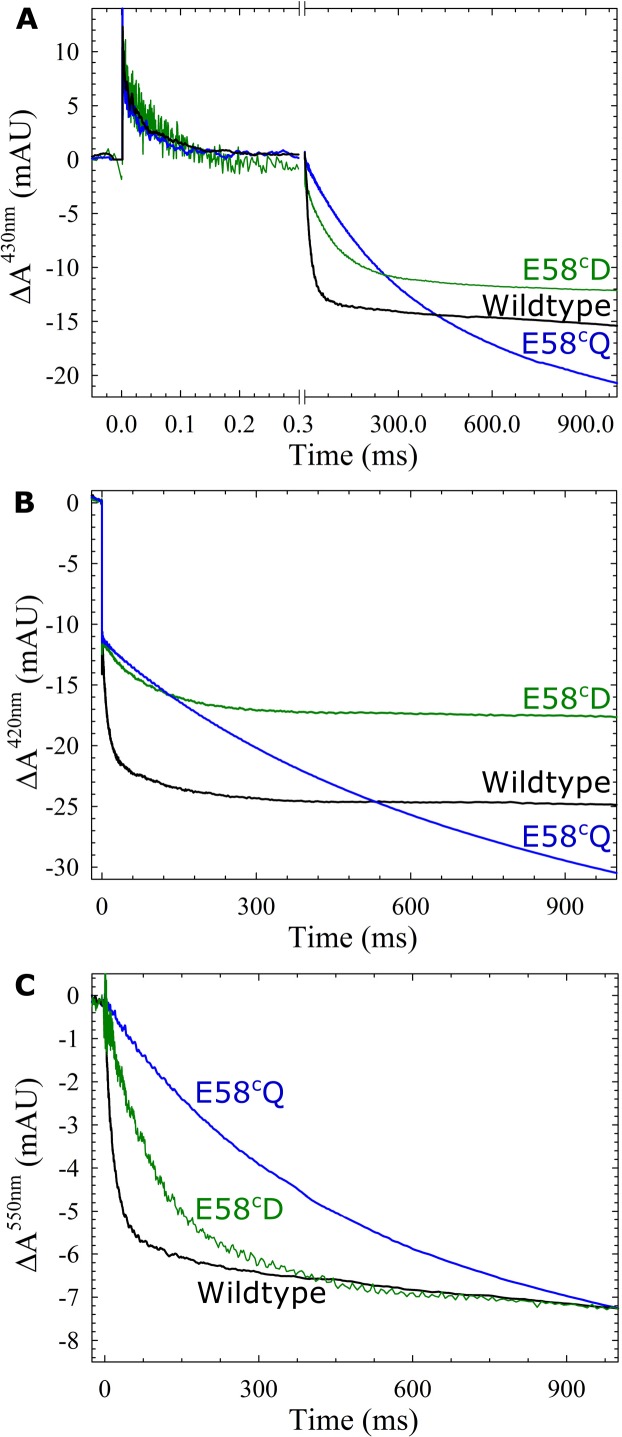
Fig 2. The reaction between fully reduced cNOR and O2, showing the effect of changing the glutamate at the entrance of pathway 1.
Fully reduced cNOR wildtype (black), E58cD (green) or E58cQ (blue) reacting with oxygen at pH 7.5. Traces show the absorbance change of cNOR as a function of time (with the laser flash dissociating CO at t = 0) at 430 nm (A), 420 nm (B) and 550 nm (C, reporting on the heme c). For clarity, the laser artefact at t = 0 has been truncated. At 420 nm and 430 nm the traces were normalized to the ΔACO,off step (variations occur in the amplitude of the ETPT, as observed before [7]). At 550 nm, the amplitudes at t = 1s were normalized to the same value in order to emphasize the changes in rate constants (the amplitude of E58cD was ~80% of wildtype). The data from wildtype and E58cQ are added for comparison from Ref. [7]. Experimental conditions: ~1 μM cNOR in 50 mM HEPES, pH 7.5, 50 mM KCl, and 0.05% (w/v) DDM, [O2] = 1 mM, T = 295K.

