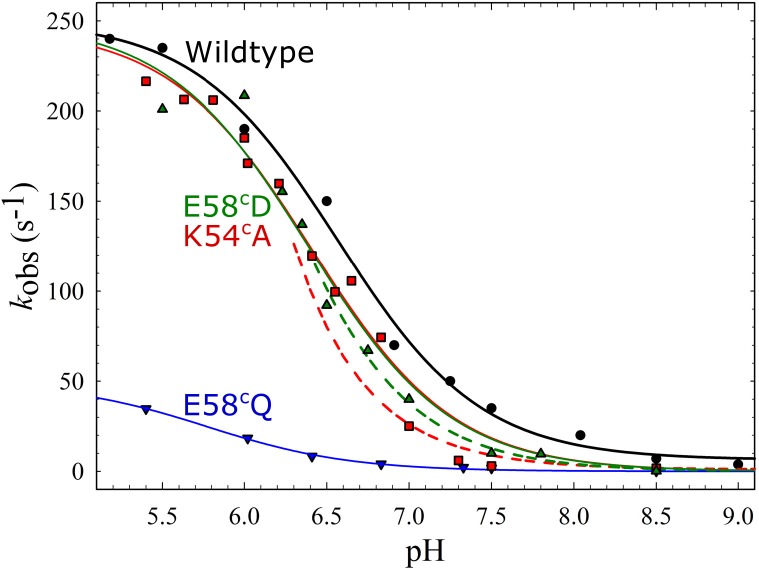
Fig 3. pH dependence of the proton-coupled electron transfer (ETPT) in the reaction between O2 and fully reduced cNOR variants at the entrance of proton transfer pathway 1.
The rate constants of the ETPT plotted as a function of pH: wild type (black circles), K54cA (red squares), E58cQ (blue triangles down), E58cD (green triangles up). The data from E58cQ, K54cA and wildtype are from Ref. [7,8] (added for comparison). The data for wildtype was fitted to a pKa ~6.6 and a kmax (maximal rate at low pH) of ~250 s-1 (black line). The data for E58cQ was fitted to a pKa of ~5.8 and a kmax of ~50 s-1 (blue line, data and fit from from Ref. [7]). The data for K54cA was fitted to a pKa of ~6.4 and a kmax of ~250 s-1 (red line, data and fit from Ref. [7]) and for E58cD to a pKa of ~6.4 and a kmax of ~250 s-1 (green line). Note that data points for K54cA as well as the E58cD do not follow the fit around pH 7–7.5, and also plotted (see text) are two theoretical diffusion rate constants (kdiff*[H+]) as a function of pH (= -log[H+]), assuming a kdiff of 2.5*108 M-1 s-1 in K54cA (red dashed line) and 3.5*108 M-1 s-1 in E58cD(green dashed line).

