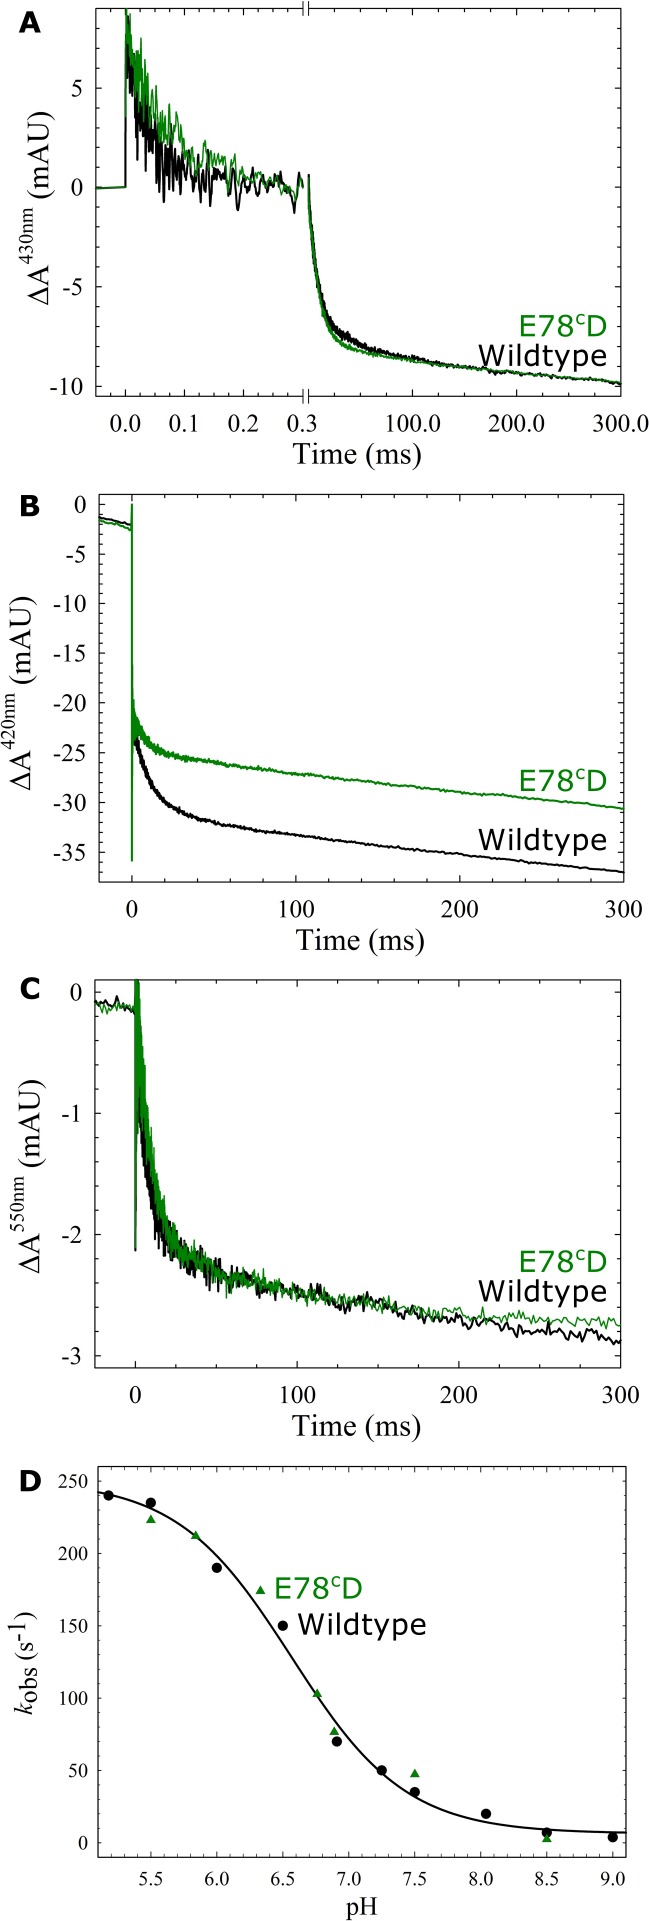
Fig 4. The reaction between fully reduced wildtype (black) or E78cD (green) cNOR and oxygen.
Traces show the absorbance change of cNOR in time (with the laser flash at t = 0) at 430 nm (A), 420 nm (B) and 550 nm (C) at pH 7.5. Normalization as in Fig 2. The laser artefact at t = 0 is truncated for clarity. D) Rate constants of the proton-coupled electron transfer (ETPT) are shown as a function of pH. Rate constants for the E78cD variant are shown as green triangles. Wildtype rate constants (black circles) and fit (black line) are from Ref. [7,8]. A-C) Experimental conditions as in Fig 2.

