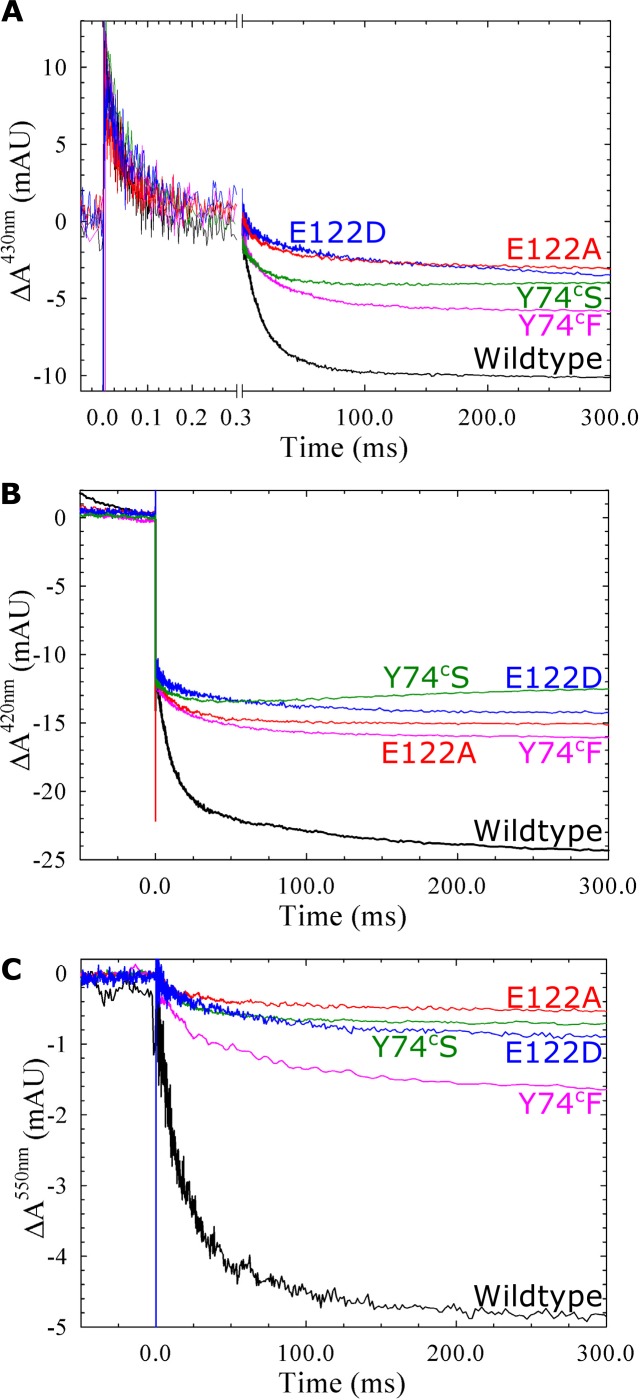
Fig 6. Reaction between oxygen and fully reduced cNOR wildtype or variants of calcium ligands E122 and Y74c.
Traces show the absorbance change of cNOR in time (with the laser flash at t = 0, which gives a short artefact) at 430 nm (A), 420 nm (B) and 550 nm (C, reporting on the heme c). At 420 nm and 430 nm the traces were normalized to the ΔA(COoff), at 550 nm the traces were normalized as at 420 nm. Experimental conditions as in Fig 2.

