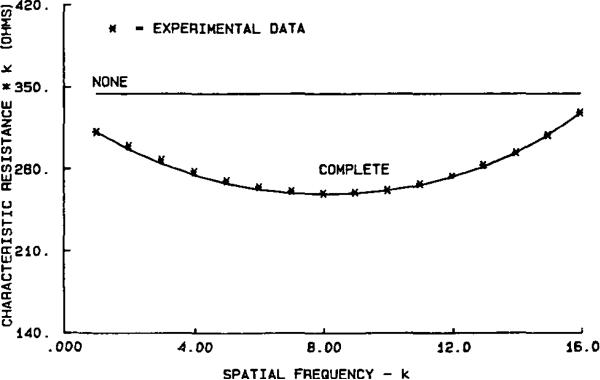
Fig. 2.
The product of characteristic resistance times spatial frequency is plotted versus spatial frequency for spatial frequencies between 1 and 16. Experimental measurements made with a homogeneous saline phantom of 284 Ω · cm resistivity are shown as asterisks. The horizontal line labeled “NONE” is the model with no electrodes considered. The curve through the asterisks labeled “COMPLETE” includes the effects of discretization, shunt, and a contact impedance of 58 Ω · cm2.

