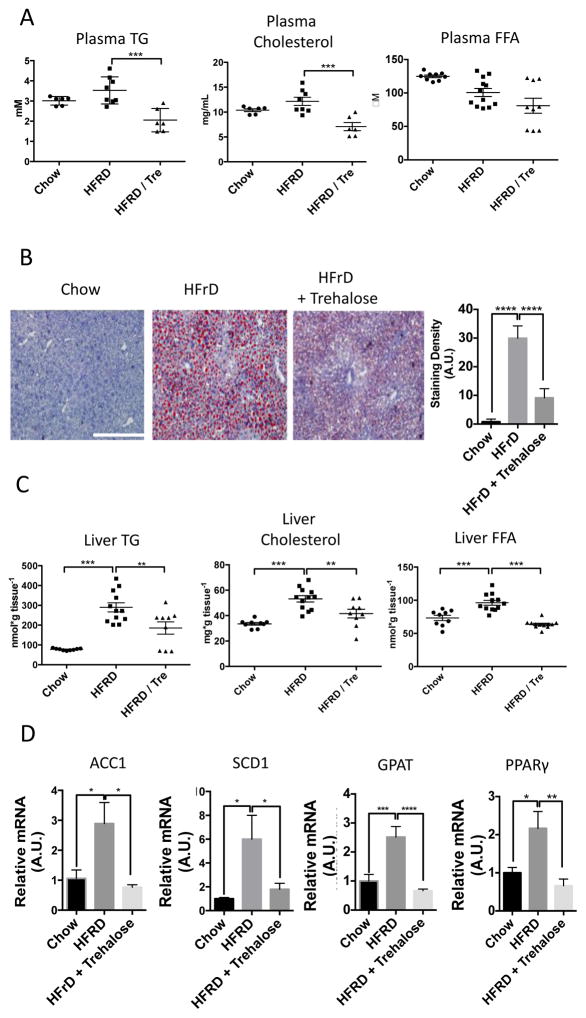
Figure 5.
Trehalose reduces HFrD-induced hepatic steatosis in vivo. A. 8 week-old mice were fed chow, 10-day 60% fructose diet or 10-day 60% fructose diet initiated two days after initiating 3% trehalose fed ad libitum in drinking water. Fasting plasma triglycerides, cholesterol and free fatty acids were quantified. Data are shown as mean ± SEM for, N = 6–12 indepedendent mice per treatment group. ***, P < 0.001 (one-way ANOVA and Sidak’s post hoc analysis). B. Left, Oil Red-O staining in frozen liver sections from mice described above. Scale bar, 200μm. Right, Blinded-observer quantification of staining red staining density (minimum 3 random fields from three cryosections obtained from three different mice per group) by ImageJ (version 1.47) densitometry software. Data are shown as mean ± SEM for, N = 9–12 mice per treatment group. ****, P < 0.0001 (one-way ANOVA and Sidak’s post hoc analysis). C. Hepatic TG, cholesterol and FFA quantification in 8 week-old mice fed chow, 10-day 60% fructose diet or 10-day 60% fructose diet initiated two days after initiating 3% trehalose fed ad libitum in drinking water. Data are shown as mean ± SEM for, N = 9–12 mice per treatment group. ****, P < 0.0001, ***, P < 0.001, and **, P < 0.01 (one-way ANOVA and Sidak’s post hoc analysis). D.Left to right, qPCR analysis of acyl-CoA carboxylase-1 (ACC1), stearyl-coA desaturase-1 (SCD1), glycerol phosphate acyltransferase (GPAT) and peroxisome proliferator antigen receptor-gamma (PPARγ) mRNA in liver tissue mRNA extracted from mice fed 10-day HFrD with or without 3% trehalose water. Target abundances are normalized to α-actin expression within each sample. Data are shown as mean ± SEM for, N = 9–12 mice per treatment group. ****, P < 0.0001, ***, P < 0.001, **, P < 0.01 and *, P < 0.05 (one-way ANOVA and Sidak’s post hoc analysis).

