. 2016 Mar 14;5:e14120. doi: 10.7554/eLife.14120

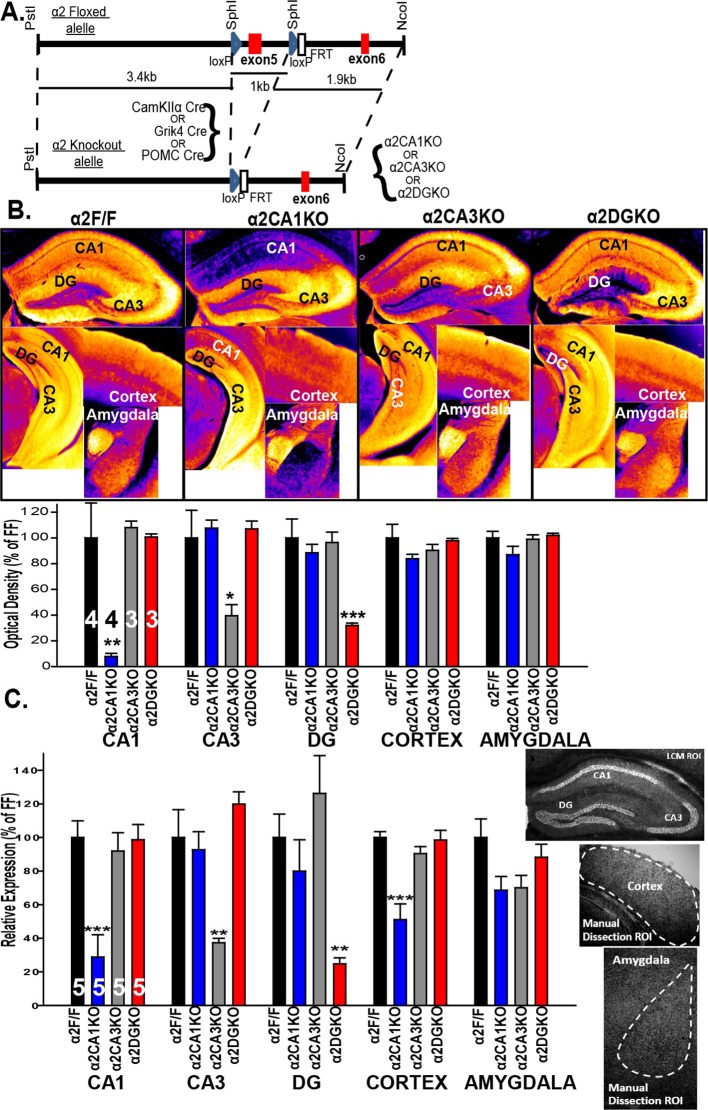
Figure 1. Targeted reduction of α2 expression in CA1, CA3 or DG.

(A) Generation of the α2F/F control and α2CA1KO, α2CA3KO, α2DGKO mice. (B) Top: False color images showing the α2 staining intensity in immunohistochemically stained sections. Cooler colors = less staining. Bottom: Semi-quantitative comparisons of α2 staining. (C) α2 mRNA expression (see sample ROI’s on the right), expressed as% of α2F/F control.*p<0.05, **p<0.01, ***p<0.001 compared to corresponding α2F/F group.

DOI: http://dx.doi.org/10.7554/eLife.14120.003

Figure 1.

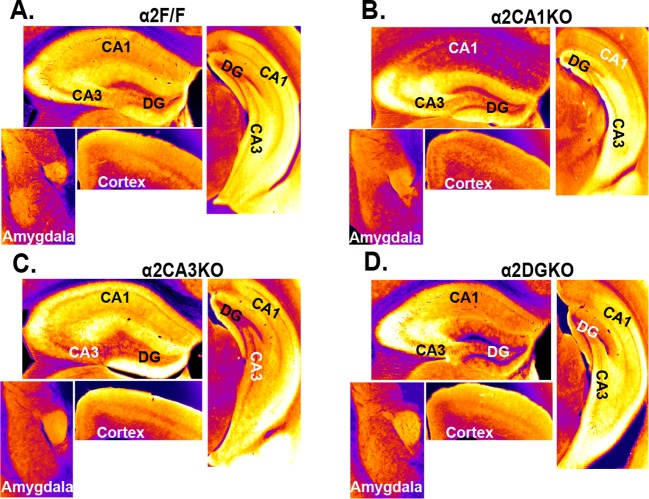
Figure 1—figure supplement 1. Immunohistochemical localization of GABAAR α2 subunits in conditional knockout mice bred on a 129X1/SvJ background.

Figure 1—figure supplement 1.

(A) False color images showing α2 staining intensity in immunohistochemically stained sections in α2F/F mice.Cooler colors = less staining. (B) Same as A for α2CA1KO, (C) Same as A for α2CA3KO, (D) Same as A for α2DGKO.
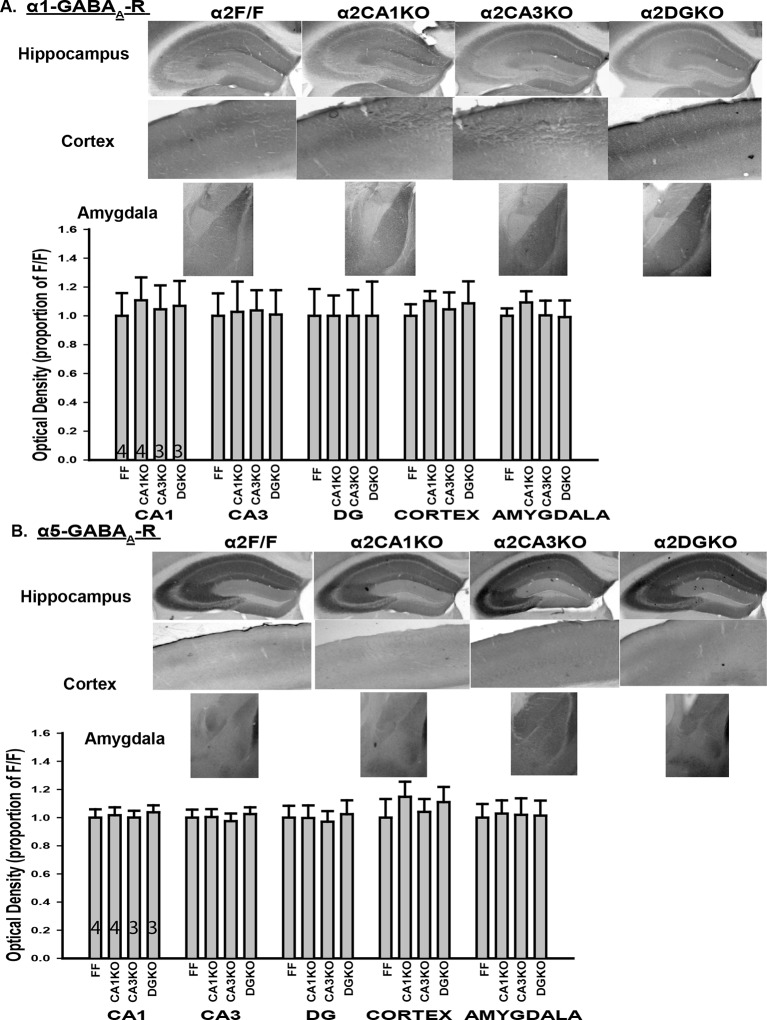
Figure 1—figure supplement 2. Expression of α1 and α5 subunits in conditional knockout mice.

Figure 1—figure supplement 2.

(A) Top: Representative gray-scale images showing the α1 staining intensity in immunohistochemically stained sections from the hippocampus, cortex and the amygdala of α2F/F, α2CA1KO, α2CA3KO and α2DGKO mice. Bottom: Semi-quantitative comparisons of α1 staining intensity between α2F/F, α2CA1KO, α2CA3KO and α2DGKO mice in CA1, CA3, DG, cortex and the amygdala. (B) Same as A for α5.
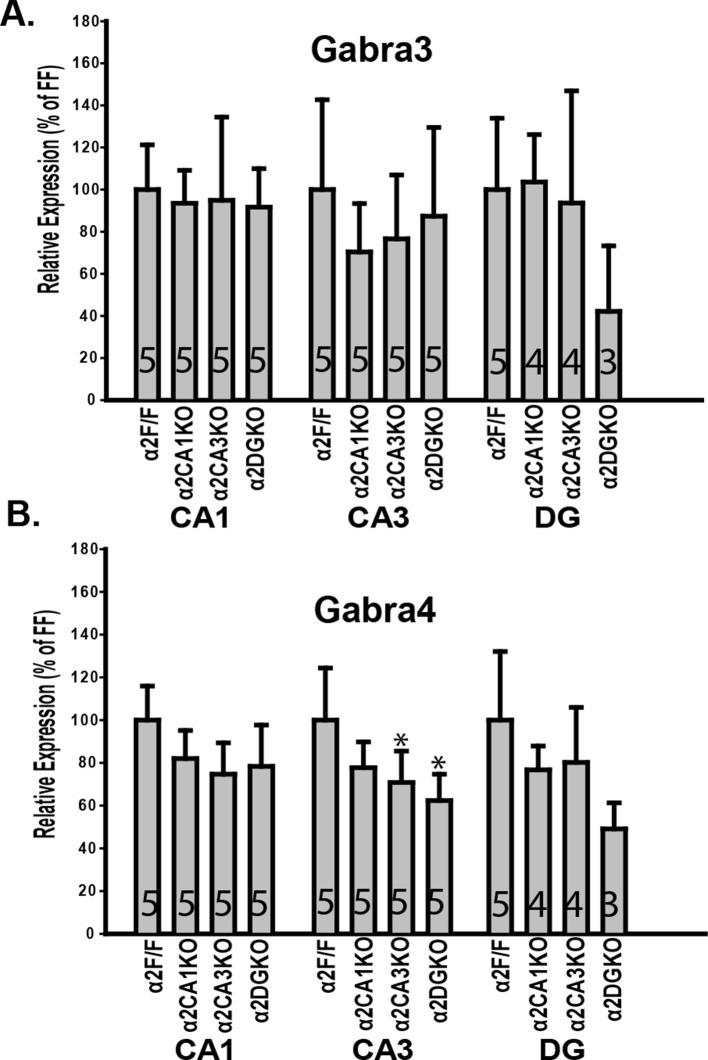
Figure 1—figure supplement 3. Expression of α3 and α4 mRNA in conditional knockout mice.

Figure 1—figure supplement 3.

(A) Gabra3 expression in CA1, CA3, DG, cortex and the amygdala of α2F/F, α2CA1KO, α2CA3KO and α2DGKO mice expressed as percentage of α2F/F control. (B) Same as A for Gabra4. *p<0.05 in comparison to the corresponding α2F/F control group.
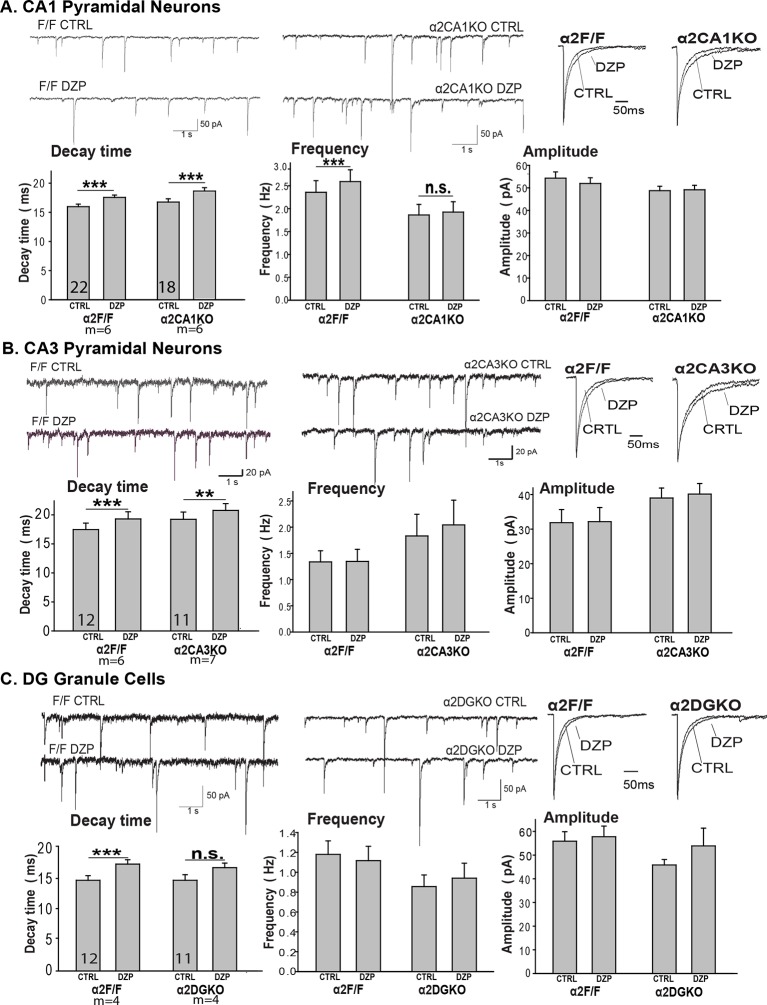
Figure 1—figure supplement 4. Miniature inhibitory postsynaptic currents.

Figure 1—figure supplement 4.

Mean ( ± S.E.M.) decay time, frequency, amplitude of mIPSCs recorded from (A) the CA1 pyramidal neurons in α2CA1KO and α2F/F sections, (B) the CA3 pyramidal neurons in α2CA3KO and α2F/F sections, (C) the DG granule cells in α2DGKO and α2F/F sections. **p<0.01, ***p<0.001. CTRL=vehicle-treated, DZP=diazepam-treated.
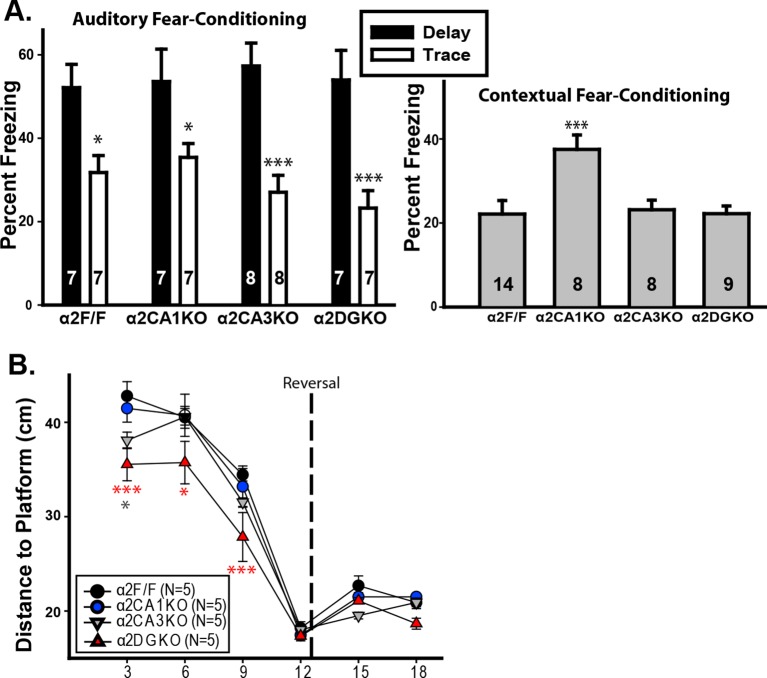
Figure 1—figure supplement 5. Tests of hippocampal function.

Figure 1—figure supplement 5.

(A) Mean ( ± S.E.M.) percentage of time spent freezing during the tone 24 hr after auditory fear-conditioning using a delay (black) or trace (white) protocol.*p<0.05, ***p<0.001, different from the corresponding delay group. No significant differences were found in planned pair-wise comparisons of the genotypes within the trace-conditioned groups or within the delay-conditioned groups. (B) Mean ( ± S.E.M.) percentage of time spent freezing during re-exposure to the context 24 hr after contextual fear-conditioning. ***p<0.001, different from α2F/F. (C) Mean ( ± S.E.M.) distance to platform during probe trials. *p<0.05, ***p<0.001, different from α2F/F; gray: α2CA3KO, red: α2DGKO.