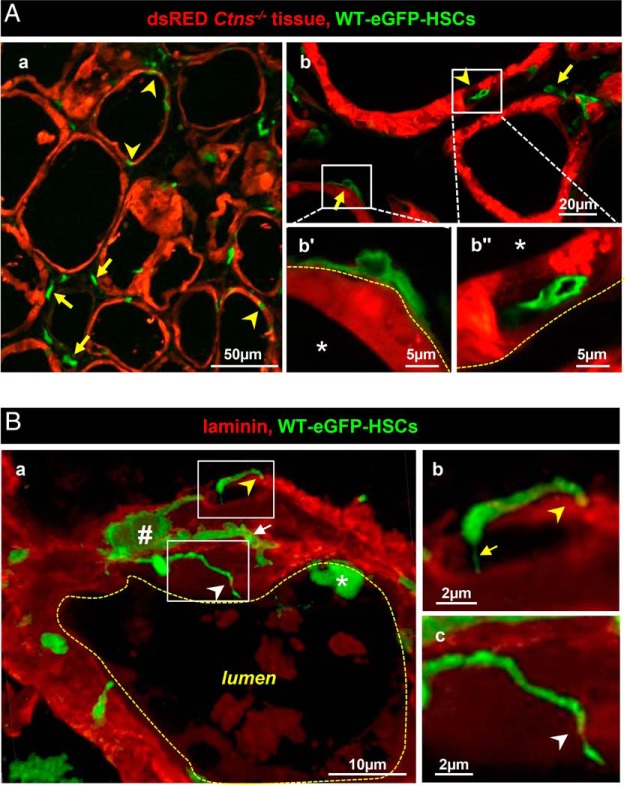
Figure 3.
Grafted WT-eGFP-HSCs produce tunneling nanotubes that perforate follicular basement lamina and squeeze into the thyrocyte monolayer. Note here the different use of red in panel A (Ctns−/− tissue) vs panel B (laminin). A, General view of spatial relation between WT-eGFP-HSCs and DsRed+-Ctns−/− thyrocytes. Double-fluorescence confocal imaging in cryostat sections of 6- (a) and 11-month (b) posttransplant Ctns−/− mice (endogenous emission from DsRed [red, thyrocytes] and GFP [green, HSCs]). a, Low magnification shows that HSCs either preferentially appose onto follicles (arrows; yellow dotted line at b′ indicating basement lamina in panel b) or appear colinear with, ie, integrate within, thyrocytes (arrowheads; inside follicular space at b″). For further views of HSCs fully incorporated into the follicle, see Supplemental Figures 3 and 5. Colloid space is indicated by asterisks. Notice that intrafollicular HSCs do not fuse with thyrocytes (no yellow signal). B, Extrafollicular HSCs produce tunneling nanotubes. Three-dimensional reconstruction of z-stack series images (0.23 μm increment, 5 μm total thickness) was obtained after double immunolabeling for green fluorescent protein (green, HSCs) and laminin (red, basement lamina) in frozen sections of grafted mice thyroid at 6 months after transplantation. a, Typical extrafollicular HSCs (#), closely apposed to the follicle basement lamina, produce slender cytoplasmic extensions, some of which bend perpendicular to (yellow arrowhead) or cross the basement lamina (white arrowhead). Extensions can be very thin (yellow arrow in panel b) or irregular and varicose (white arrow in panel a). Notice the local absence of laminin indicating basement lamina discontinuities allowing TNT passage (better seen in enlargement in panel c) and the overall mottled aspect of follicular basement lamina. Asterisk indicates another, intrafollicular HSC. For rotating view, see Supplemental Video 1. For comparison of laminin structure between WT and Ctns−/− vs grafted Ctns−/−, see Supplemental Figure 4.

