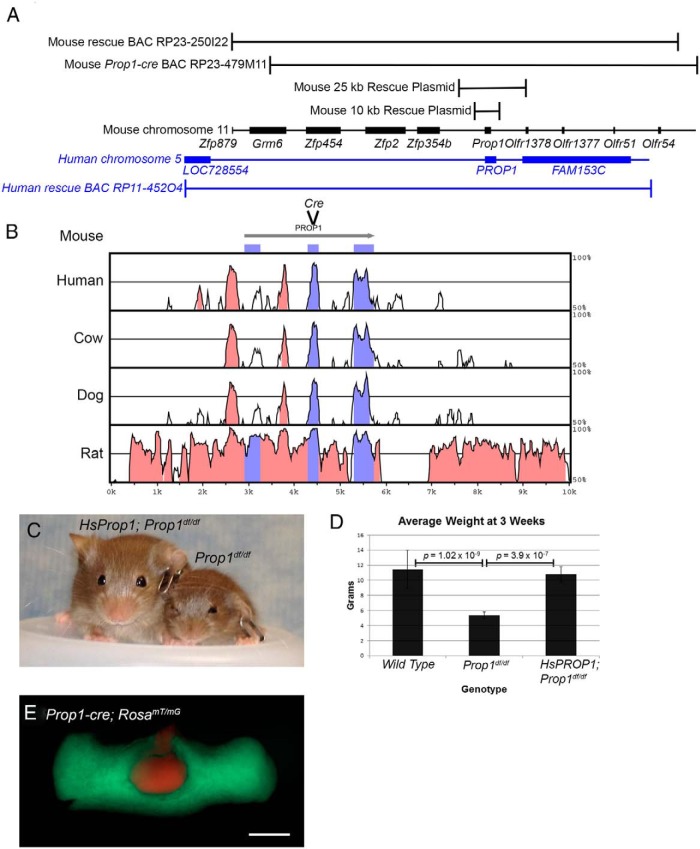
Figure 1.
Prop1 genomic regions and conservation, Prop1-cre generation, and HsPROP1 transgenic rescue. A, Schematic diagram of mouse Prop1 genomic region on chromosome 11 (black) and human PROP1 on chromosome 5 (blue) as visualized using the UCSC Genome Browser (http://genome.ucsc.edu). Black brackets above the genomic schematic indicate the portion of mouse chromosome 11 contained in the original rescue BAC, RP23-250I22, the BAC used for generating the Prop1-cre, RP23-479M11, and 2 rescue plasmids of 25 and 10 kb. The blue bracket below the genomic schematic indicates the portion of human chromosome 5 contained in HsPROP1 BAC RP11-452O4. B, VISTA plot (http://genome.lbl.gov/vista/mvista/submit.shtml) comparing conserved genomic regions between mouse, human, cow, dog, and rat genomes in the region of the 10-kb rescue plasmid. Pink peaks indicate CNSs and purple peaks represent conserved coding sequences. Also indicated is the location where the cre cassette was inserted into BAC RP23-479M11 to generate Prop1-cre. C, Three-week-old HsPROP1; Prop1df/df transgenic and Prop1df/df mice. D, Graph of average weight at 3 weeks for wild-type, Propdf/df, and HsProp1; PROP1df/df mice. Brackets indicate P values for 2-tailed, t tests between wild-type (n = 37) and Prop1df/df (n = 11) and between Prop1df/df and HsPROP1; Prop1df/df (n = 18) mice. E, Pituitary from a 3-week-old Prop1-cre; RosamT/mG mouse. Green fluorescence indicates recombination from Prop1-cre, and red fluorescence indicates no recombination. Scale bar, 500 μm.

