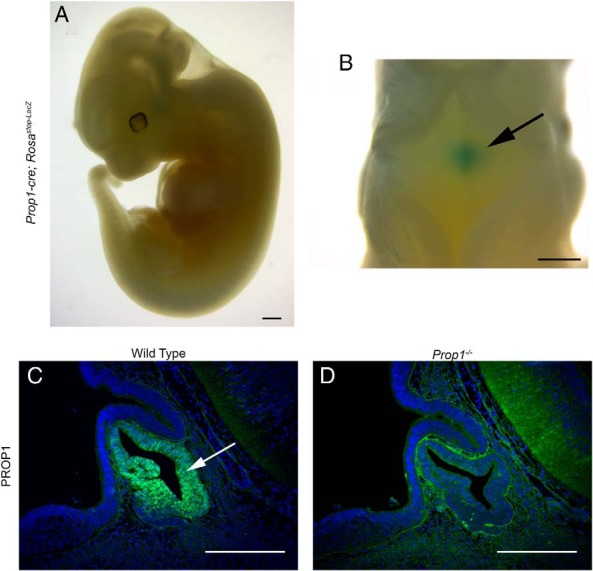
Figure 2.

Pituitary-specific Prop1-cre activity and PROP1 immunostaining. A and B, Whole mount X-gal-stained e11.5 Prop1-cre; Rosastop-Lacz embryo. Blue indicates LacZ activity and cre expression. A, Lateral view. B, Dorsal view. Arrow indicates the developing pituitary gland as seen through the hindbrain. C and D, PROP1 expression (green) assayed by immunostaining, and counterstained with DAPI (blue), on e12.5 sagittal sections. C, Wild type. Arrow indicates PROP1 expression in Rathke's pouch. D, Prop1−/−. Scale bars, 500 μm (A and B) and 100 μm (C and D).
