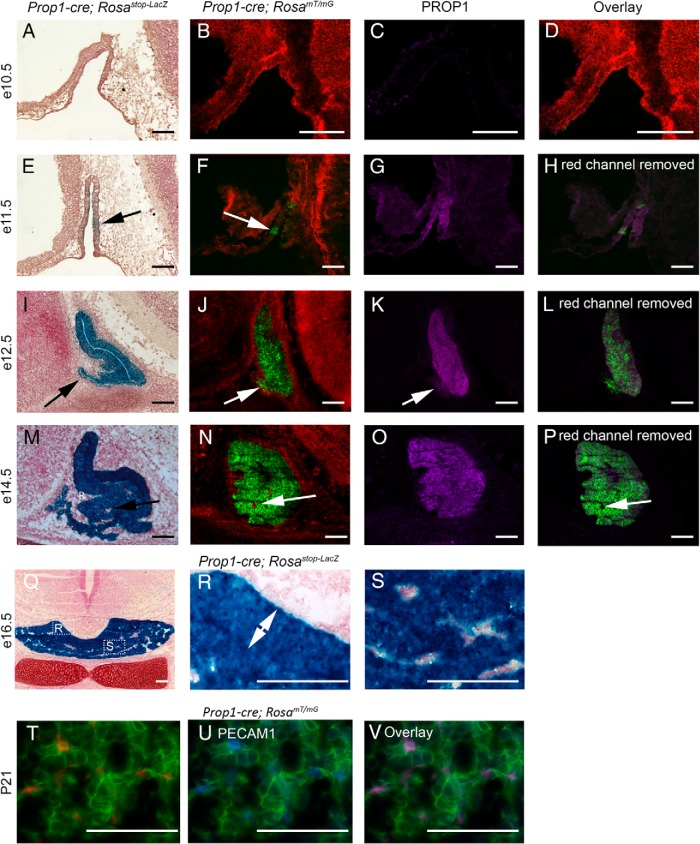
Figure 3.
Prop1-cre activity compared with PROP1 expression. A–D, e10.5 sagittal sections. E–H, e11.5 sagittal sections. I–L, e12.5 sagittal sections. M–P, e14.5 sagittal sections. Q–S, e16.5 coronal sections. T–V, Postnatal day 21 (P21) pituitary coronal sections. A, E, I, M, Q, R, and S, Prop1-cre; Rosastop-LacZ embryos X-gal stained (blue) to indicate LacZ activity caused by cre recombination, and counterstained with neutral red. Arrow in E indicates small region of LacZ activity. Arrow in I indicates LacZ activity in the rostral tip. B, F, J, and N, Prop1-cre; RosamT/mG embryos where red fluorescence indicates no cre activity and green fluorescence indicates cre recombination. Arrow in F indicates a small region of cre activity. Arrow in J indicates cre activity in the rostral tip. Arrow in N indicates a region with no cre activity (red). C, G, K, and O, PROP1 immunostaining (purple) on the same sections as B, F, J, and N. Arrow in K indicates no expression of PROP1 in the rostral tip. D, Overlay of Prop1-cre; RosamT/mG and PROP1 immunostaining images. H, L, and P, Overlay of eGFP fluorescence and PROP1 immunostaining. Arrow in P indicates a small region with no cre activity and no PROP1 expression in the pituitary anterior lobe. R and S, Boxed regions in Q, presented at higher magnification. Double arrow in R indicates the intermediate lobe. T, Fluorescence from Prop1-cre; RosamT/mG tdTOMATO (red) and eGFP (green). U, Same image as T, with the red channel removed and immunostained for PECAM1 (blue). V, Same image as T with all 3 channels, demonstrating colocalization of PECAM1 with tdTOMATO. Sale bars, 100 μm.

