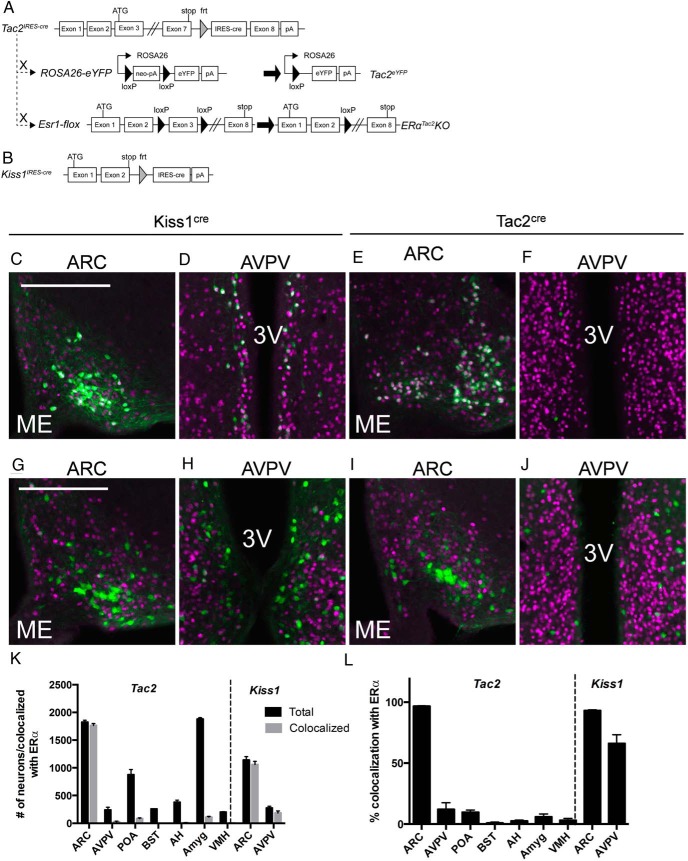
Figure 1.
Generation of mice to study Kiss1- and Tac2-expressing neurons and coexpression of ERα and eYFP in Tac2eYFP and Kiss1eYFP female mice. Tac2cre mice carry an IRES-cre cassette in the 3′-UTR of the endogenous murine Tac2 gene (A). Kiss1cre mice carry the same IRES-cre cassette in the 3′-UTR of the murine Kiss1 gene (B). Both cre lines were crossed to ROSA26-eYFP and Esr1-flox animals to generate fluorescent reporter and neuron-specific ERα deletion strains (shown for Tac2cre). eYFP- and ERα-IR (pseudocolored green and purple, respectively) in the ARC (C) and the AVPV (D) of a Kiss1eYFP mouse and in the ARC (E) and AVPV (F) of a Tac2eYFP mouse. eYFP- and ERα-IR (pseudocolored green and purple, respectively) in the ARC (G) and the AVPV (H) of a Kiss1eYFP/ERαKiss1KO mouse and in the ARC (I) and AVPV (J) of a Tac2eYFP/ERαTac2KO mouse. Neurons expressing both eYFP and ERα appear white. 3V, third ventricle; ME, median eminence. K, Counts of Tac2 and Kiss1 neurons in Tac2eYFP and Kiss1eYFP female mice in the indicated brain regions (black bars) and numbers of Tac2 and Kiss1 neurons colocalized with ERα (gray bars). L, Data from K plotted to show % Tac2 and Kiss1 neurons colocalizing with ERα in each region. Mean ± SEM is plotted (from a 1:4 series through the brains of n = 3 animals per genotype).

