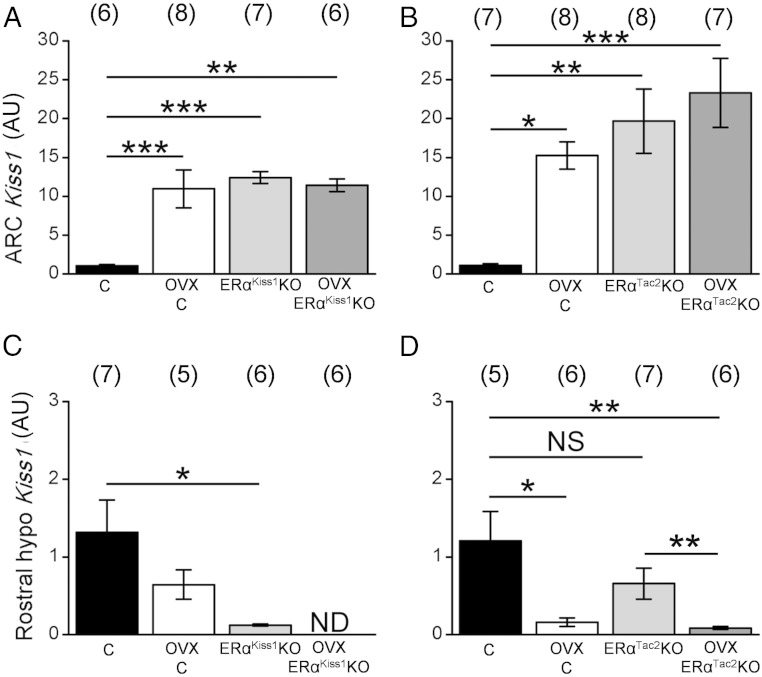
Figure 3.
Kiss1 expression in intact and OVX ERαKiss1KO and ERαTac2KO females. Relative expression of Kiss1 in the ARC (A and B) or rostral hypothalamus (C and D) of intact and OVX control and ERαKiss1KO (left panels) or ERαTac2KO (right panels) adult females. Numbers in parentheses above each bar denote the n for each measurement. Two-way ANOVA, Bonferroni post hoc: *, P < .05; **, P < .01; ***, P < .001. NS, not significant; ND, not detected.

