Figure 1.
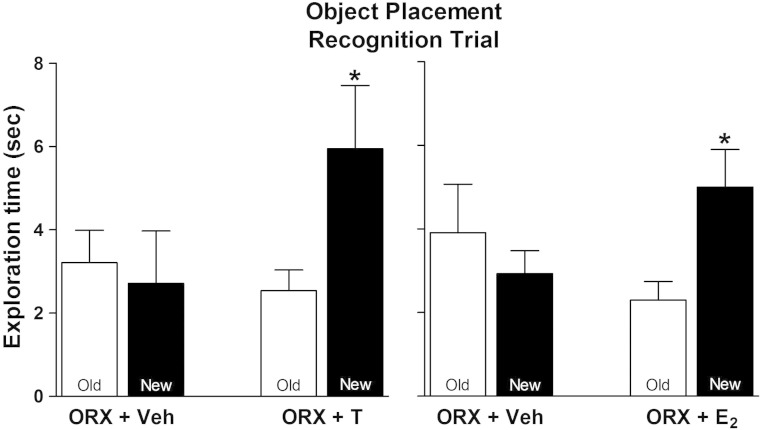
Effects of acute T and E2 treatment on OP. Time spent exploring objects at old and new location is shown for vehicle- and E2-treated (left panel) and vehicle- and T-treated (right panel) subjects (n = 6 and 7 for vehicle- and hormone-treated groups, respectively). Entries are mean ± SEM. *, P < .05, by paired t test.

