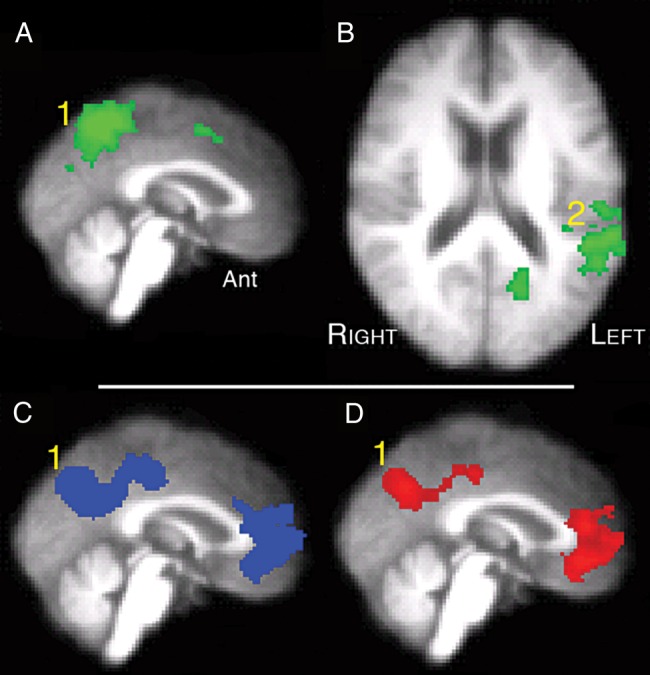
Figure 4.

Univariate whole-brain analysis of Study 2, exploring 3 contrasts with a voxel-level threshold Z > 2.3 and cluster-level threshold, P < 0.05. (A) (sagittal midline projection) and (B) (axial section): dichotic (FLEFTMRIGHT + MLEFTFRIGHT) against diotic (FMDIOTIC + FBABBLE) projected as a green overlay. (1) precuneus, (2) left planum temporale and adjacent anterior inferior parietal lobe (PT/IPL). (C) (sagittal midline projection): rest against Diotic projected as a blue overlay. (1) Precuneus and adjacent posterior cingulate cortex (PCC). (D) (Sagittal midline projection): Rest against Dichotic projected as a red overlay. (1) Precuneus and PCC.
