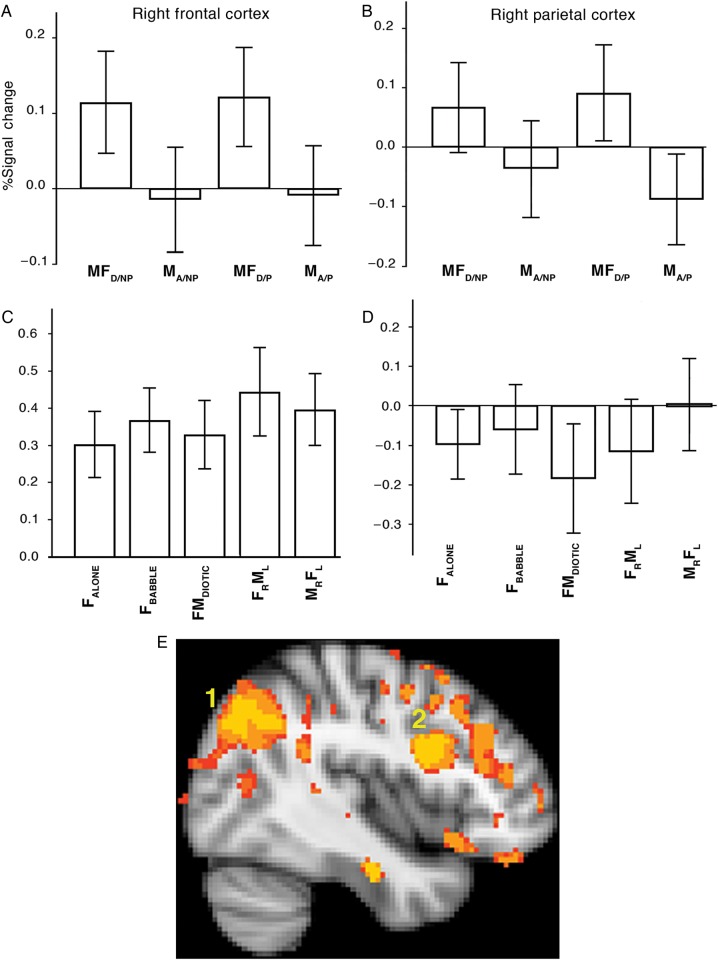
Figure 6.
Region-of-interest analysis: (A–D) Percentage blood oxygen-level-dependent signal changes for each condition relative to the rest baseline condition. Error bars are the 95% confidence intervals. Study 1 is depicted in Panels (A) and (B); Study 2 is depicted in Panels C and D. (A) and (C) The results from the ROIs in the right middle frontal gyrus (MFG) and (B) and (D) from the ROIs in the right supramarginal gyrus (SMG). Conditions labeled as in the text, but with the following abbreviations: MFD/NP = (MFDIOTIC/NON-PREDICTABLE); MA/NP = (MALONE/NON-PREDICTABLE); MFD/P = (MFDIOTIC/PREDICTABLE); MFA/P = (MFALONE/PREDICTABLE), L = left; R = right. (E). A sagittal view of the right hemisphere, at X coordinate = 42 mm. The contrast of diotic with single speaking conditions was directly compared in whole-brain analyses between Studies 1 and 2. Predictably, from the profile of activities observed in the ROI analyses, both right frontal (labeled 2) and parietal cortices (labeled 1) were more “active” in Study 1. However, this disguises the dissociation of responses between frontal and parietal cortices: The loss of “contrast” in Study 2 was due to an increase in activity in response to a single speaker in frontal cortex, but a decline in activity in response to diotic listening in parietal cortex.

