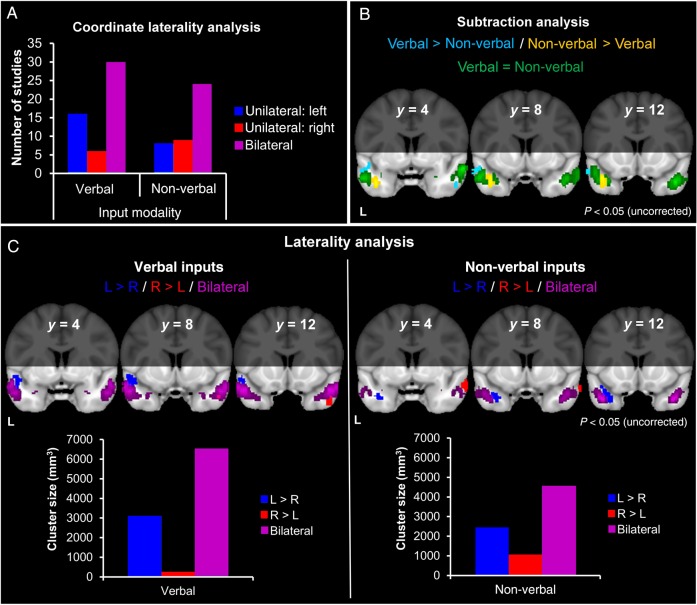
Figure 2.
Influence of sensory input modality. (A) The number of studies contributing unilateral or bilateral coordinates. (B) Regions within the ATLs with greater activation likelihood for verbal inputs, compared with non-verbal inputs (light blue). Regions within the ATLs with greater activation likelihood for non-verbal inputs compared with verbal inputs (yellow). Regions with equal activation likelihood for both study types (green). (C) Laterality analysis for verbal and non-verbal inputs. Regions within the ATLs more likely to be active in the left, compared with the right, ATL (dark blue). Regions within the ATLs more likely to be active in the right, compared with the left, ATL (red). Regions within the ATLs with equal activation likelihood in both hemispheres (purple).

