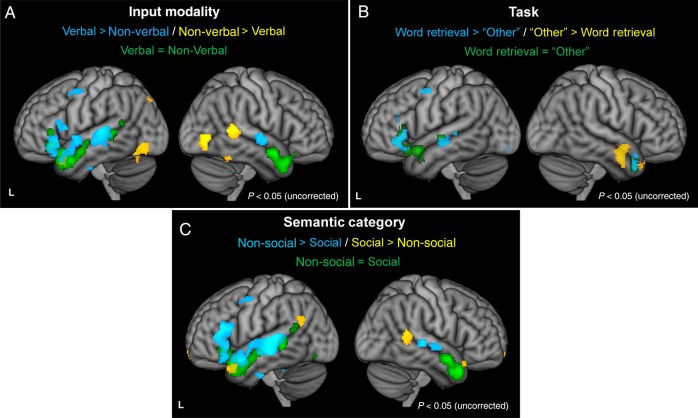
Figure 5.
Subtraction analyses across the whole brain. (A) “Input modality”: Regions with greater activation likelihood for verbal inputs, compared with non-verbal (blue). Regions with greater activation likelihood for non-verbal inputs compared with verbal (yellow). (B) “Word retrieval”: Regions with greater activation likelihood for word retrieval, compared with other tasks (blue). Regions with greater activation likelihood for other tasks compared with word retrieval (yellow). (C) “Semantic category”: Regions with greater activation likelihood for non-social semantics, compared with social (blue). Regions with greater activation likelihood for social semantics compared with non-social (yellow). In all panels, regions with equal activation likelihood for both study types (green).

