
Figure 2.
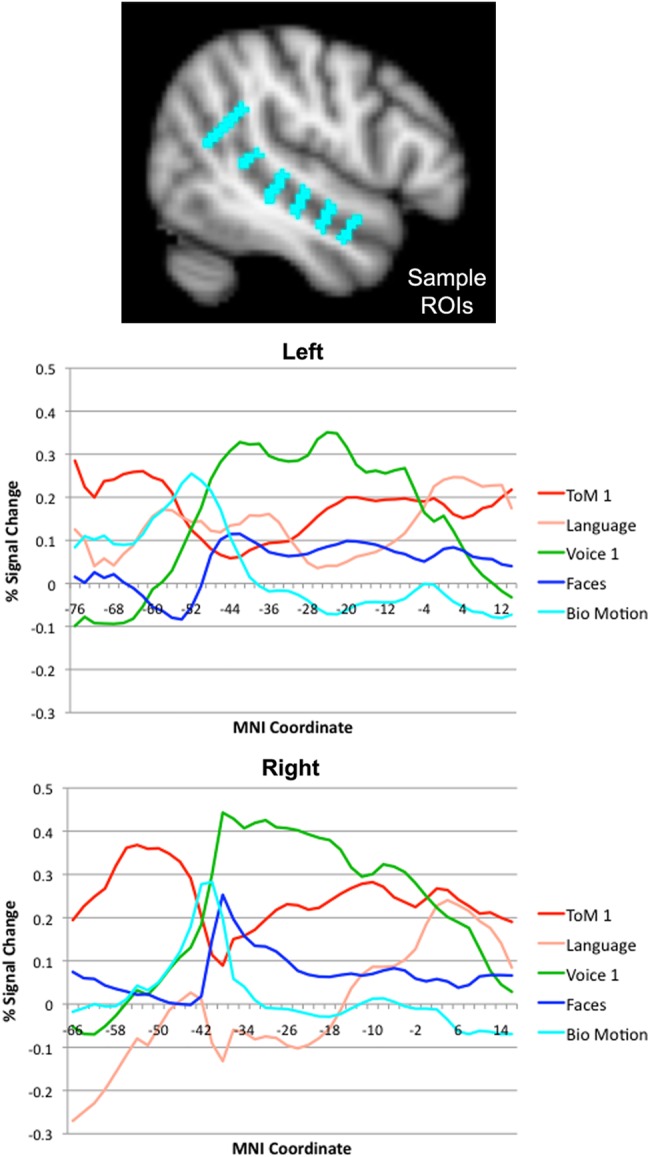
Responses to each task as a function of position along the length of the STS. The upper figure shows the ROIs that were used to extract responses at each position. The lower 2 graphs show left and right STS responses (percent signal change) for each task, as a function of y-coordinate in MNI space.