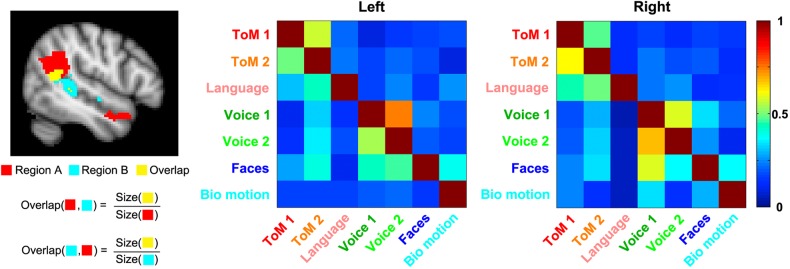
Figure 5.
Overlap matrices for regions of activation defined by each task contrast. Each cell in a given overlap matrix is equal to the size of the overlapping region for the tasks on the corresponding row and column, divided by the size of the region of activation for the task on that row, as shown in the graphic on the left-hand side.

