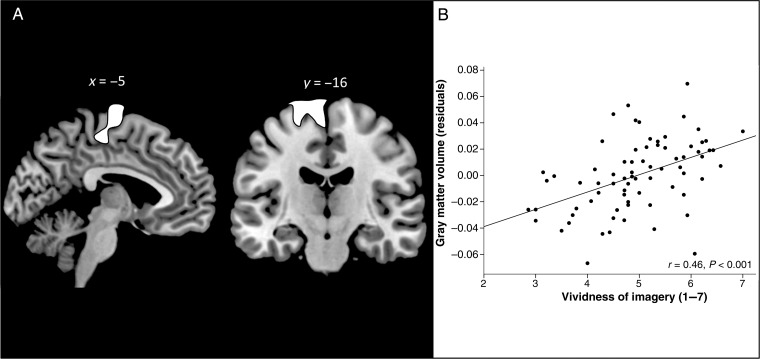
Figure 1.
Association between gray matter volume and vividness of auditory imagery. (A) Cluster with peak in left SMA showing a significant positive correlation with vividness of auditory imagery in whole-brain analysis. Statistical maps were thresholded at P < 0.005 peak-level uncorrected, cluster corrected with a FWE correction (P < 0.05). (B) Scatterplot showing the association between vividness ratings and adjusted gray matter volume within the cluster depicted in (A).

