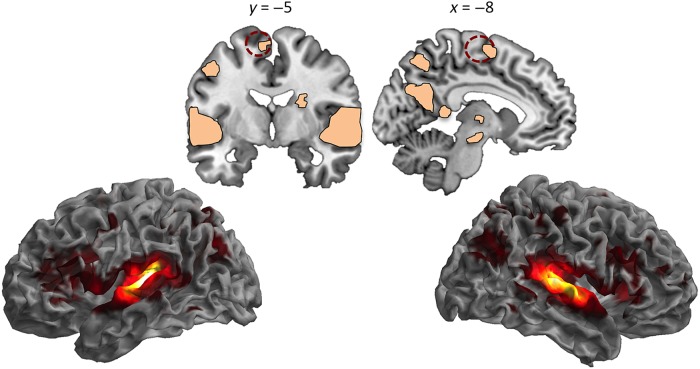
Figure 2.
Brain regions in which BOLD responses were modulated by sound type during the processing of heard auditory information. The dotted dark red circle denotes a 12-mm sphere centered at the peak of the SMA cluster where the amount of gray matter was shown to correlate with auditory imagery (VBM study); this sphere was used for the representational similarity analysis looking at the links between representational specificity of heard sounds and vividness of imagery. For visualization purposes, activation maps were thresholded at P < 0.005 peak-level uncorrected (full details of activated sites are presented in Table 2).

