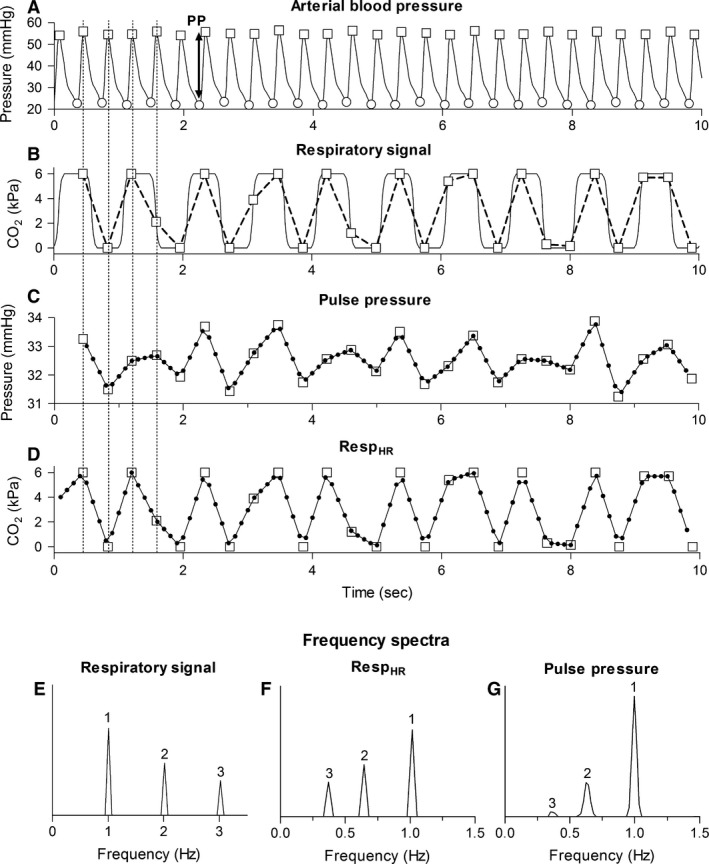
Figure 1.

Representation of the steps performed during the data analysis (HR = 2.7 Hz, SIMV with RR = 1 Hz). (A) Arterial blood pressure with systolic (squares) and diastolic blood pressure (circles). (B) Respiratory signal (CO 2, solid line), respiratory signal values obtained at the moment that the systolic pressure is reached (squares) and RespHR (dashed line). (C) Interpolated PP signal. The squares depict PP at the moment systolic pressure is reached. (D) Interpolated RespHR. The squares depict the respiratory value at the moment systolic pressure was reached. (E) Frequency spectrum of the respiratory signal containing: RR (1), 2RR (2), and 3RR (3). (F, G) Frequency spectrum of RespHR and PP containing RR (1) and the alias frequencies of 2RR and 3RR (2 and 3, respectively). HR, heart rate; RR, respiratory rate; PP, pulse pressure; RespHR, the respiratory values at the moment systolic pressure was reached.
