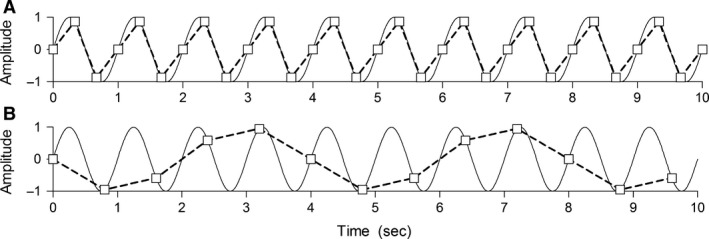
Figure 2.

Aliasing: the solid line is a sinusoidal waveform of 1 Hz and represents the respiratory signal; the squares are the obtained samples (representing the heartbeats). The dashed line is the reconstructed sinusoidal waveform (based on the squares), representing RespHR. (A) RR =1 Hz and HR = 3 Hz, the respiratory signal is adequately represented as sinusoidal waveform of 1 Hz. (B) RR = 1 Hz and HR = 1.25 Hz, the sinusoidal waveform is undersampled which results in a reconstructed sinusoidal waveform with a lower frequency, in this case 0.25 Hz (the alias frequency). RR, respiratory rate; HR, heart rate.
