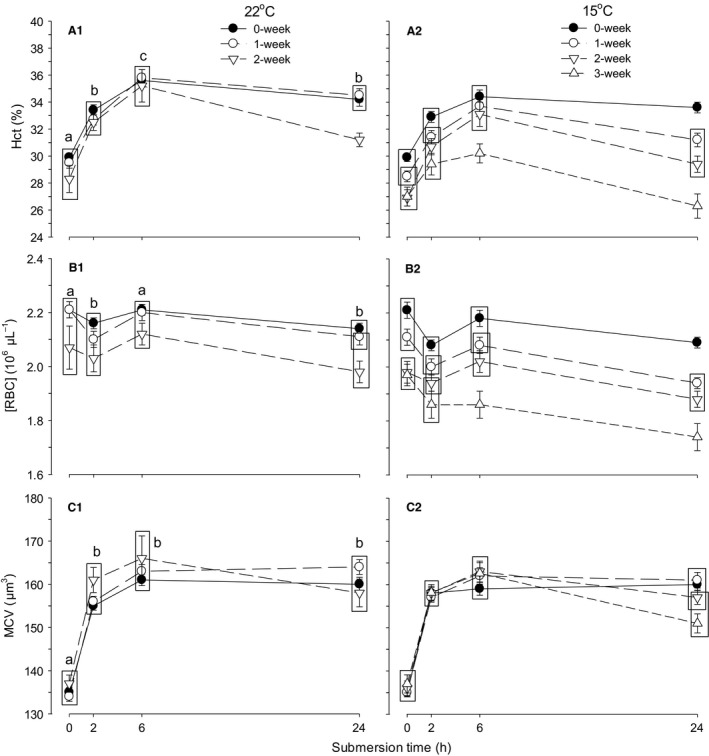
Figure 4.

Time‐specific changes in hematocrit (Hct) (panel A1, A2), red blood cell concentration ([RBC]) (B1, B2), and mean corpuscular volume (MCV) (C1, C2) during 24 h of water submersion in d15 embryos stored as eggs for 0 (nonstorage), 1, and 2 weeks at 22°C and additionally 3 weeks at 15°C. Mean values ± 1 SEM are plotted (N is shown in Table 3). Means not significantly different from each other are grouped within the same box. Different letters indicate significant difference between submersion times for all storage procedures (except 3 weeks) combined.
