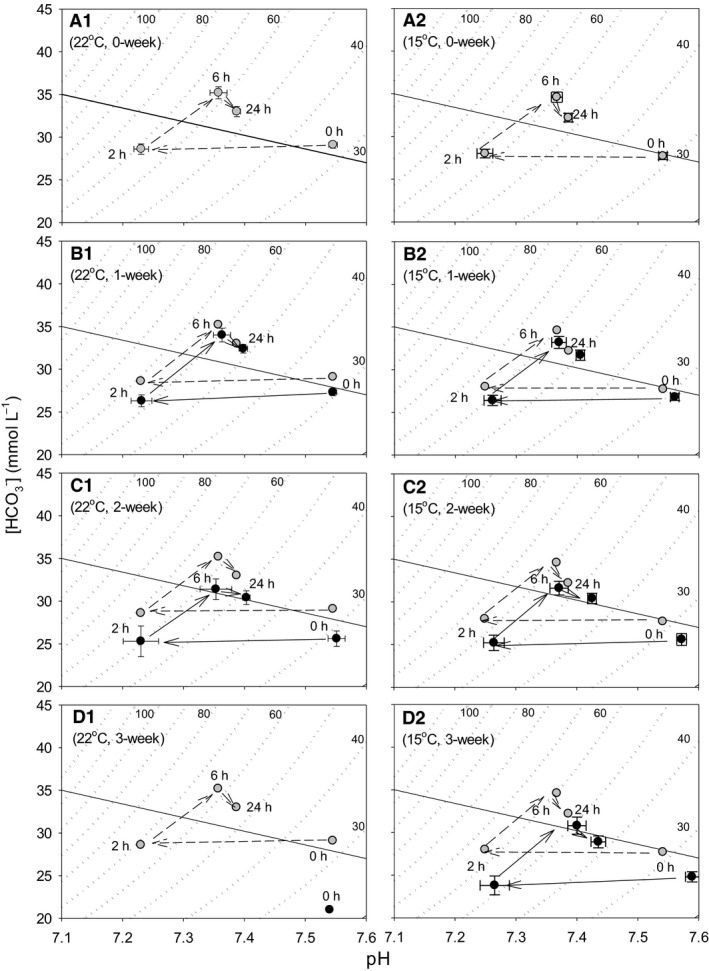
Figure 6.

Time‐specific changes of acid–base disturbances during 24 h of water submersion in d15 embryos stored as eggs for 0 (panel A1), 1 (B1), 2 (C1), and 3 weeks (0 h only) (D1) at 22°C, and in eggs stored for 0 (panel A2), 1 (B2), 2 (C2), and 3 (D2) weeks at 15°C. Mean values ± 1 SEM are plotted (N is shown in Table 3). The time‐specific changes in eggs without storage (0 week, A1 and A2) are connected by broken lines and shown in other panels for visual comparison with eggs stored for 1, 2, and 3 weeks. The dotted curves are pco 2 isopleths of which values are indicated by small numerical figures. The diagonal solid line is buffer line indicating buffer value of −16 mmol L−1 pH −1.
