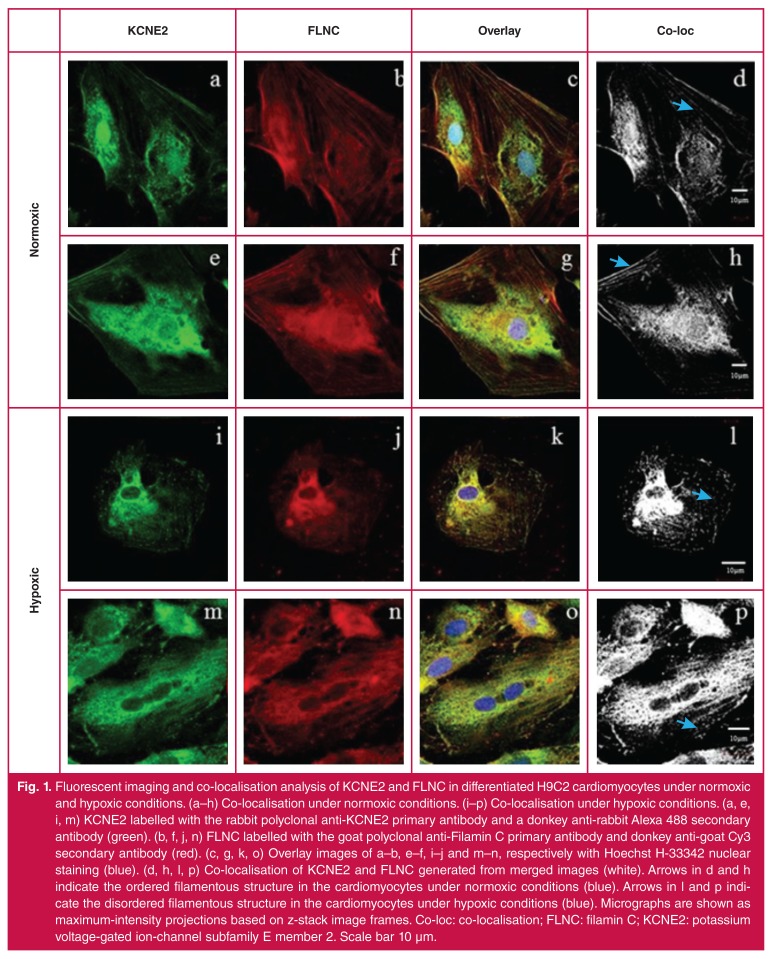
Fig. 1.
Fluorescent imaging and co-localisation analysis of KCNE2 and FLNC in differentiated H9C2 cardiomyocytes under normoxic and hypoxic conditions. (a–h) Co-localisation under normoxic conditions. (i–p) Co-localisation under hypoxic conditions. (a, e, i, m) KCNE2 labelled with the rabbit polyclonal anti-KCNE2 primary antibody and a donkey anti-rabbit Alexa 488 secondary antibody (green). (b, f, j, n) FLNC labelled with the goat polyclonal anti-Filamin C primary antibody and donkey anti-goat Cy3 secondary antibody (red). (c, g, k, o) Overlay images of a–b, e–f, i–j and m–n, respectively with Hoechst H-33342 nuclear staining (blue). (d, h, l, p) Co-localisation of KCNE2 and FLNC generated from merged images (white). Arrows in d and h indicate the ordered filamentous structure in the cardiomyocytes under normoxic conditions (blue). Arrows in l and p indicate the disordered filamentous structure in the cardiomyocytes under hypoxic conditions (blue). Micrographs are shown as maximum-intensity projections based on z-stack image frames. Co-loc: co-localisation; FLNC: filamin C; KCNE2: potassium voltage-gated ion-channel subfamily E member 2. Scale bar 10 μm.

