Fig. 5.

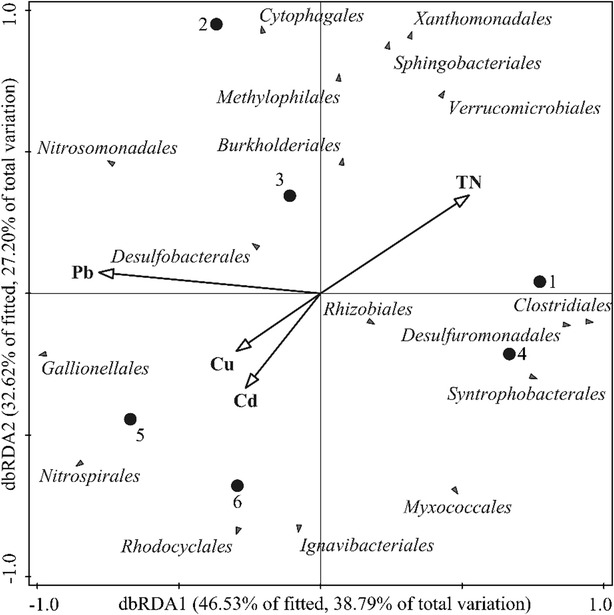
Distance based redundancy analysis (dbRDA) biplots of the sediment bacterial communities associated with environmental variables. Black and solid circles indicate different samples; grey triangles indicate different taxa

Distance based redundancy analysis (dbRDA) biplots of the sediment bacterial communities associated with environmental variables. Black and solid circles indicate different samples; grey triangles indicate different taxa