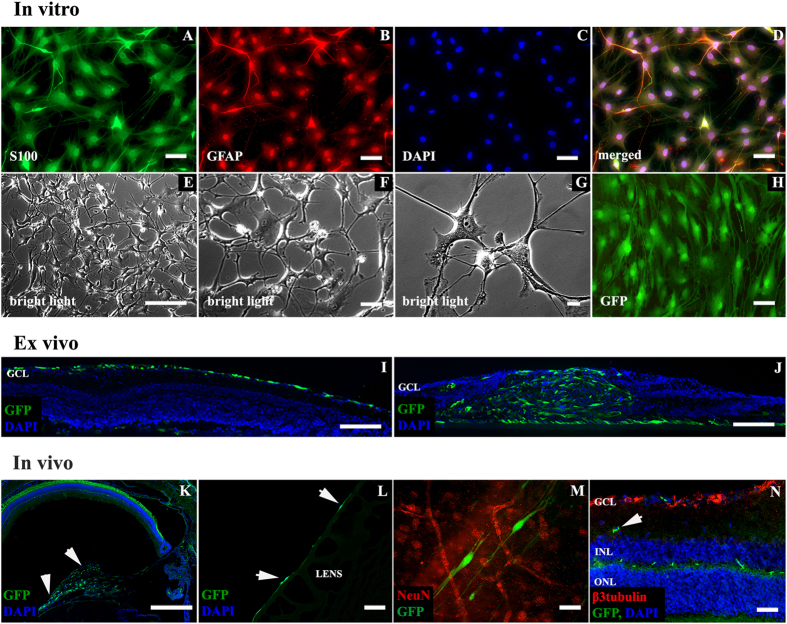
Figure 1. Schwann cells in in vitro, ex vivo and in vivo conditions.
(A–H) – immunofluorescent characterization (A–D), SC in culture (E–G) and GFP expression after Lv-eGFP transduction (H). Scale bar = 50 μm (A–D,H); 500 μm (E); 100 μm (F); 20 μm (G). (I–J) – ex vivo retinal explants. (I) – SC cultured with explants with intact ILM are covering retinal surfaces with no signs of intraretinal penetration. (J) – mechanical interruption of the ILM resulted in massive infiltration of retinal tissue by SC accompanied by damage of lamellar retinal architecture. Scale bar = 100 μm (I,J). (K–N) – localization of SC after intravitreal transplantation in vivo. SC (arrows) detected as a bolus in vitreal space (K) on posterior lens surface (L) some of SC were integrated with retinal surface (M). Only single SC were observed in deeper retinal layers (N, arrow). Scale bar = 500 μm (K); 50 μm (L–N). GCL- ganglion cell layer; INL – inner nuclear layer; ONL – outer nuclear layer.

