Figure 3.
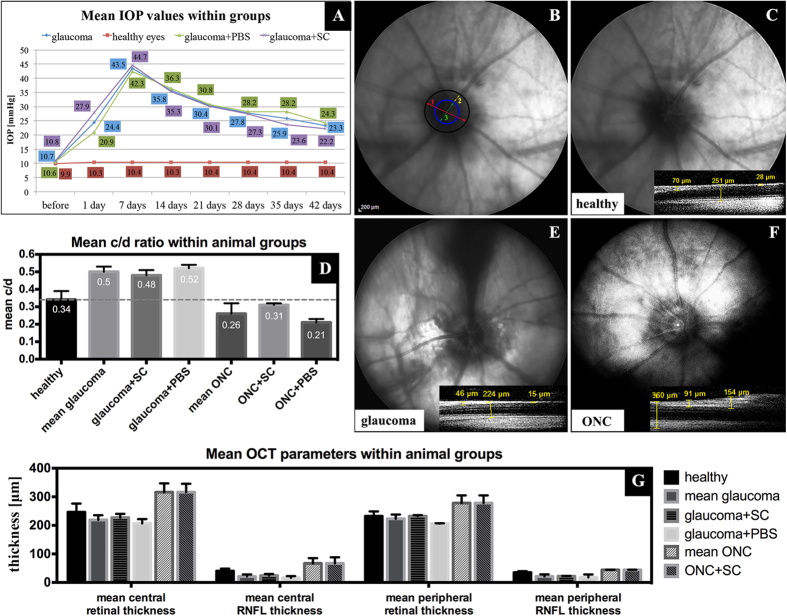
Mean IOP values in experimental glaucoma groups (A); stable elevated IOP with no differences between treated and control groups ensures “pressure independent” protective effects towards RGC. Examples of eye fundus evaluation (B-G). B – a schematic anatomical characterization of optic nerve disc in fundus photograph; 1-optic nerve disc diameter (red); 2-neuroretinal ring diameter (yellow); 3-optic nerve cup diameter (green); cup/disc (c/d) ratio=3/1; for healthy eyes c/d ratio~0.3. C-F – example fundus photographs and c/d ratio in healthy, glaucomatous and ONC eyes; small OCT scans represent examples of retinal thickness in parapapillary area. Increased c/d ratio in glaucomatous eyes due to a thinning of the neuroretinal rim and a decreased c/d ratio in ONC eyes due to retinal nerve fiber edema. G - OCT retinal parameters in healthy, glaucomatous and ONC eyes. In the ONC group with intravitreal PBS injection, insight into eye fundus was very limited and capture of OCT scans was impossible. A statistical comparison between groups of animals was not perform due to the small sample size. ONC - optic nerve crush; SC - Schwann cells.

