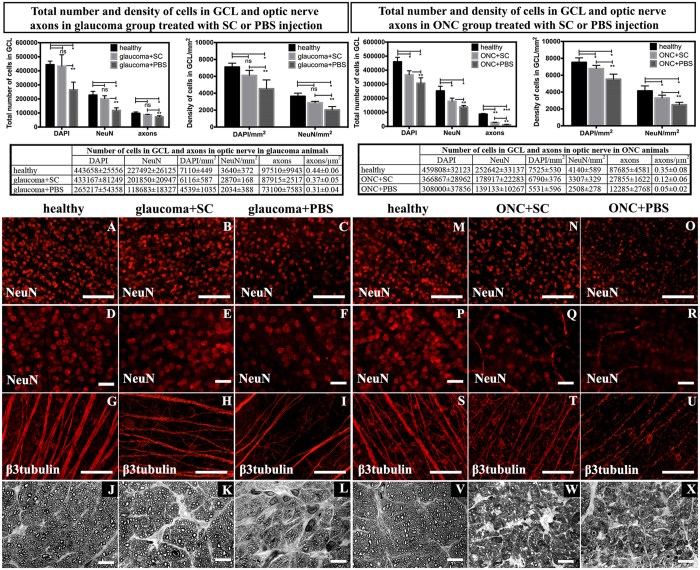
Figure 4. Total number and density of DAPI- and NeuN-positive cells in the GCL and optic nerve axons in glaucoma and ONC eyes.
The upper panel contains graphs presenting exact quantitative analysis and statistical comparisons. SC therapy showed neuroprotective activity towards RGC when compared with control PBS injection. A single asterisk indicates statistical significance at the level of p < 0.05, double asterisk p < 0.01 and triple asterisk p < 0.001. (A–I, M–U) – immunostainings of whole mounted retinas showing GCL cells positive for NeuN with visible reduced cells density within PBS-treated retinas (A–F in glaucoma group; M–R in ONC group) and β3tubulin with marked lower density and thinning of RGC axons (G–I in glaucoma group and S–U in ONC group). (J–L), (V–X) – optic nerve cross-sections in glaucoma and ONC; optic nerves from PBS-treated groups showed severe changes including gliosis, axons swelling and macrophages infiltration, while SC-treated groups presented only mild changes in glaucomatous optic nerves and moderate injury after ONC. Scale bar = 50 μm (D–F), (P–R); 500 μm (A–C), (M–O), (G–I), (S–U); 10 μm (J–L), (V–X) SC – Schwann cells; ONC – optic nerve crush.

