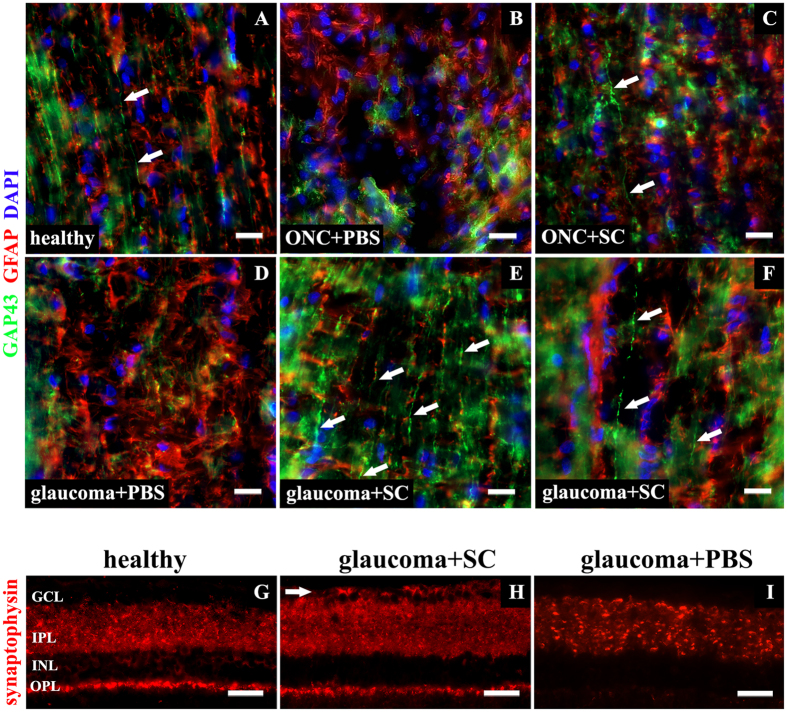
Figure 6. Neuroregeneration and neuroplasticity in vivo.
(A–F) – longitudinal sections of retrobulbar, unmyelinated optic nerve portion. (A) – single GAP43-positive fibers in healthy optic nerve (arrows); (B) – ONC treated with PBS injection, no visible neurites outgrowth; (C) – ONC treated with SC injection with single GAP43-positive fiber visible (arrow); (D) – glaucoma treated with PBS injection, no visible neurites outgrowth; (E–F) – glaucoma treated with SC injection, numerous, parallel GAP43-positive fibers detected within optic nerve (arrows). Samples were additionally stained for glial marker – GFAP to confirm presence of optic nerve reactive gliosis accompanying damage. Scale bar = 20 μm. (G–I) – retinal cross-sections presenting different pattern of synaptophysin expression within retina. In healthy retinas (G) synaptophysin expression was visible mostly within IPL and OPL, additionally perinuclear staining was visible in INL and punctate in GCL. Glaucomatous retinas treated with SC-injection (H) presented increased expression of synaptophysin, particularly in IPL. Additionally, strong expression of this synaptic marker was visible in the GCL (arrow). In glaucoma samples treated with PBS, decreased expression of synaptophysin within the IPL and outer plexiform layer OPL was observed (I). Scale bar = 50 μm. GCL - ganglion cell layer; INL - inner nuclear layer; IPL - inner plexiform layer; OPL - outer plexiform layer. SC – Schwann cells; ONC – optic nerve crush.

