
Fig. 1.
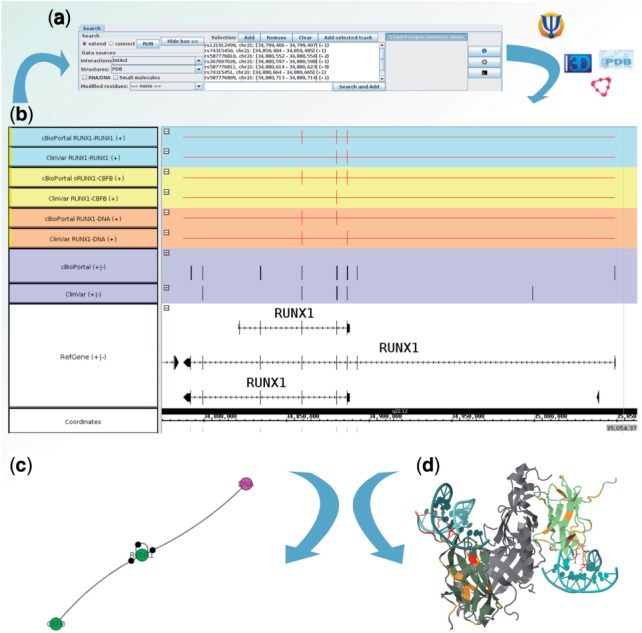
Mapping RUNX1 variations to molecular interactions. (a) Genomic variations for RUNX1 are loaded from ClinVar and cBioPortal (purple tracks). (b) Some variations are identified at the interface with CBFB (yellow tracks), DNA (orange track) and RUNX1 (homodimer, blue track). (c) Network representation: the black circles on the edges indicate a variation on the interaction interface. (d) Structure visualization: affected residues in contact with DNA are displayed in red (PDB:1HD9)