
Figure 1.
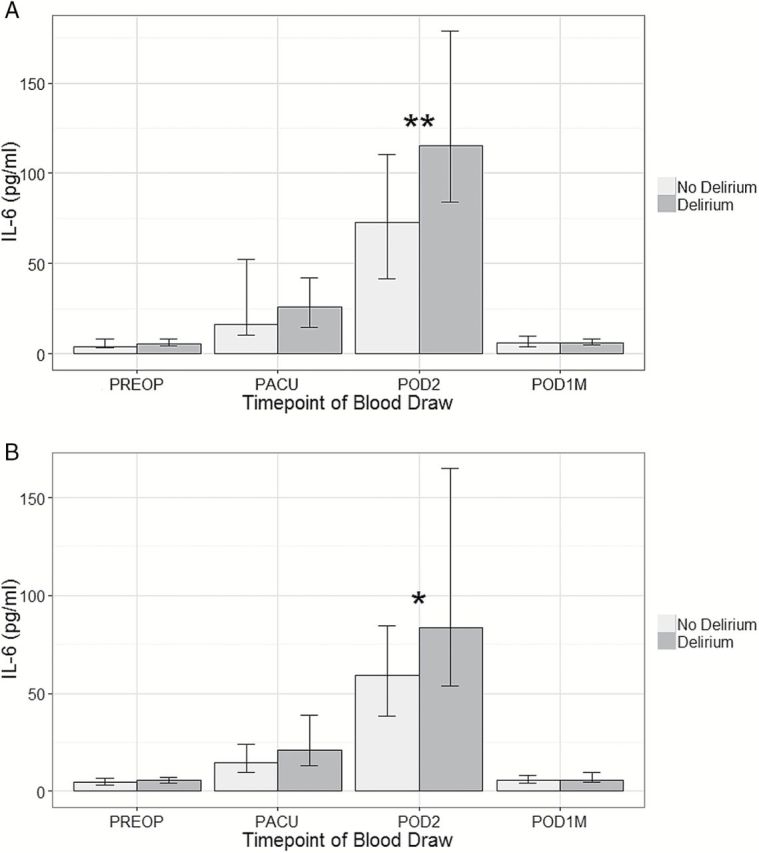
Bar graph of median interleukin (IL)-6 concentrations by delirium status at four timepoints in the (a) discovery cohort and (b) replication cohort. Based on signed-rank test: *p < .05, **p < .01. Vertical bars indicate 25th and 75th percentile measurements (in pg/mL). PREOP = Preoperative, PACU = postanesthesia care unit, POD2 = postoperative day 2, POD1M = 30 days postoperation.