
Figure 2. Distribution of the distance between the centers of mass of the N-terminal domains in the Hsp90 complexes with different ligands.
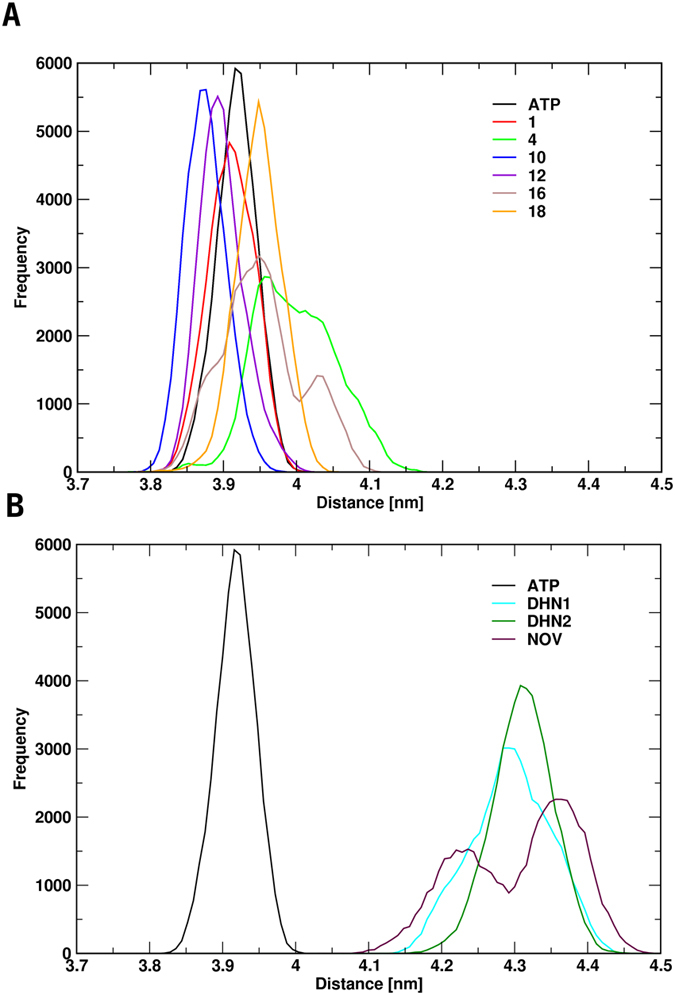
Panels A and B show the distributions of the distances of the N-terminal domains of the complexes formed with the activating ligands (A) and the inhibiting ligands (B). As a reference, all panels include the distributions of the interprotomer distances of the simulations in the presence of ATP only (APO).