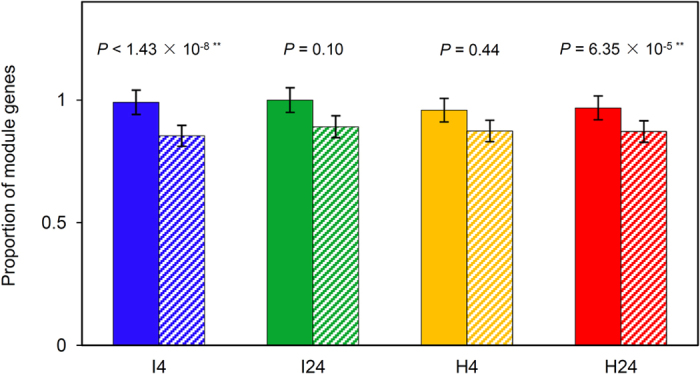
Figure 4. Enrichment test of PMRR genes in the modules in I4, I24, H4 and H24 GCNs.

The test was executed using the numbers of module genes, PMRR genes and non-PMRR genes in each GCN. Solid bars represent the proportion of module genes among PMRR genes; striped bars represent the proportions of module genes among non-PMRR genes. Error bars indicate ± 1 s.e.m. P-values were calculated based on Fisher’s exact test.
