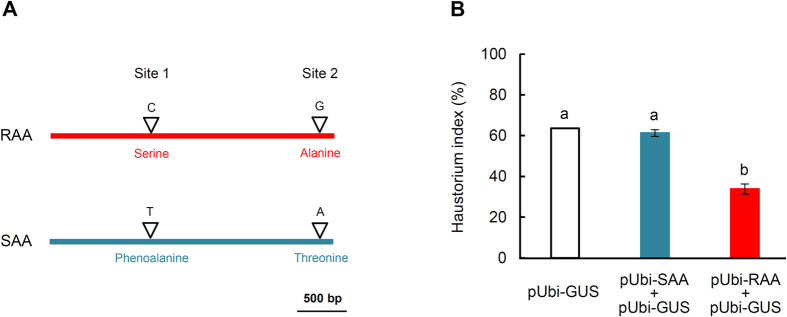
Figure 7. Comparative analysis of resistance associated allele (RAA) and susceptibility associated allele (SAA) of the NLR gene TRIUR3_01037.
(A) A diagram illustrating the two SNP sites (Sites 1 and 2) in the coding region of RAA and SAA. These two SNPs were used to genotype F2 individuals in the cosegregation analysis. The first SNP caused a serine to phenoalanine substitution whereas the second one rendered an alanine to threonine replacement. (B) The effects of ectopically expressing RAA or SAA on Bgt haustorium index in single-cell functional expression assay. The cells were transiently transformed by pUbi-GUS alone (as control), pUbi-RAA + pUbi-GUS (for expressing RAA) or pUbi-SAA + pUbi-GUS (for expressing SAA), followed by Bgt inoculation. About 200 infected cells were examined for haustorium growth in each treatment. Haustorium index (mean ± SD) was calculated as the percentage of examined cells with haustorium presence. The means marked by different letters are statistically different (ANOVA, P < 0.05).

