
Figure 4.
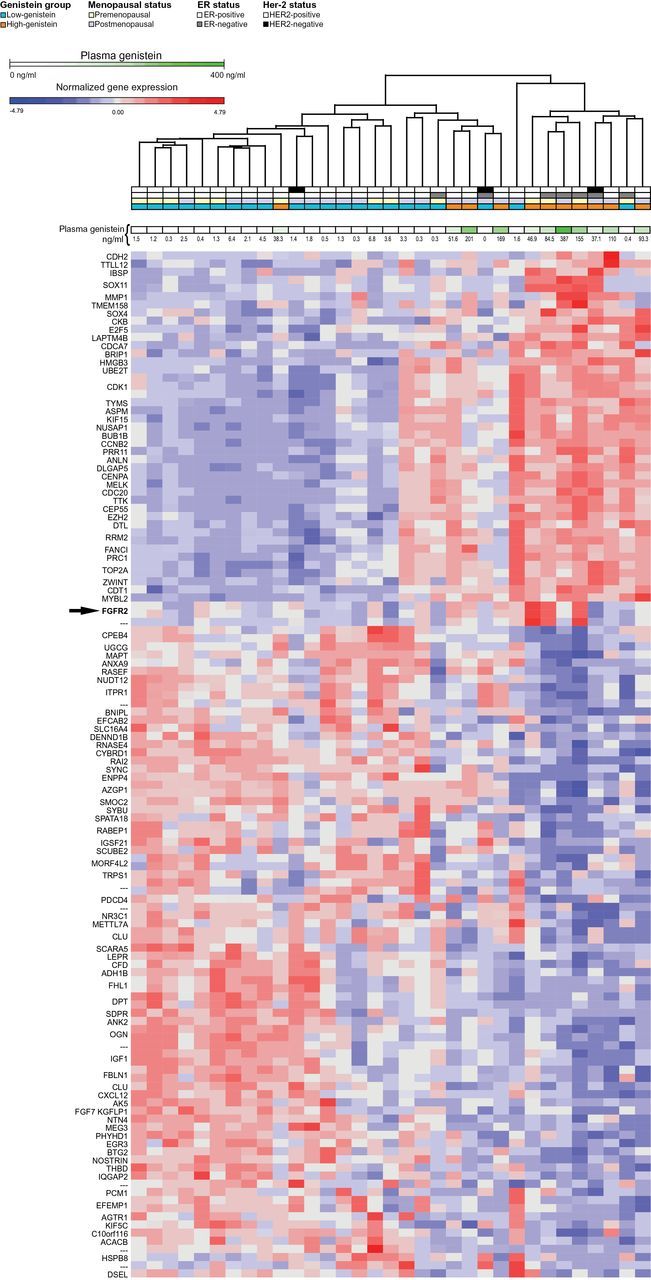
Hierarchical clustering of DE genes in high versus low- genistein subsets. Clustering of samples and 126 DE genes between high- and low-genistein samples (fold change > 2 and t-test P < .1) as identified by microarrays. Clustering was performed using Euclidian distance. Gene expression values are log2 transformed and standardized. ER status, menopausal status, and genistein plasma concentrations for each sample are indicated. Twelve tumors of the soy group with high (>16ng/mL) plasma genistein defined the high-genistein subset, and 22 tumors of the placebo group with low (<6.8ng/mL) genistein defined the low-genistein subset. FGFR2 was overexpressed in three of 12 tumors of the high-genistein group (arrow, P < .01).