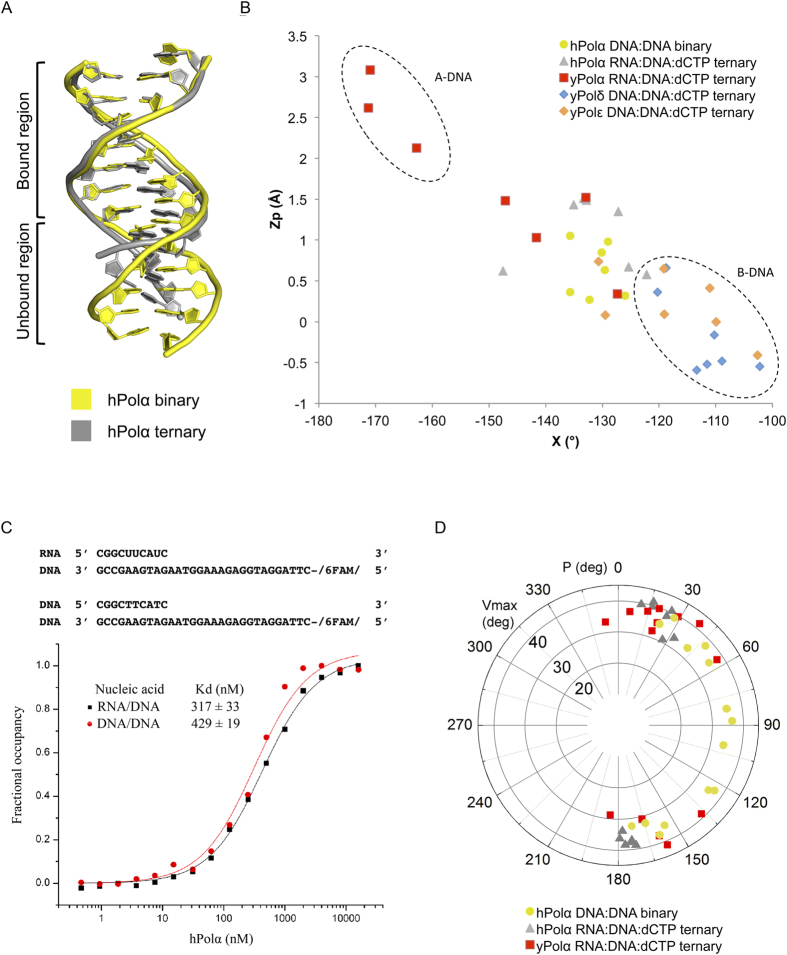
Figure 4. Conformation of nucleic acid.
(A) Comparison of the DNA conformations of the hPolα binary complex (yellow) and the hPolα ternary complex (gray). The bound and unbound regions are marked in the figure. (B) Scatter plot of Zp, the mean z-coordinate of the backbone phosphorous atoms with respect to individual dinucleotide reference frames, against the mean value for the four χ torsion angles at each dinucleotide step. The values for 7 DNA:DNA base steps bound to hPolα in the binary complex are shown as yellow circles. The 7 RNA:DNA base steps bound to hPolα in the ternary complex (PDB code 4 QCL) are shown as gray triangles. The values for RNA:DNA steps bound to yPolα (red squares), DNA:DNA steps bound to yPolδ (blue diamonds) and DNA:DNA steps bound to yPolε (orange diamonds) are also plotted. (C) Binding affinities of hPolα for DNA/DNA and RNA/DNA measured by a fluorescence anisotropy assay. The fraction of DNA/DNA or RNA/DNA bound is plotted versus hPolα concentration (logarithmic scale) in order to determine the dissociation constants. (D) Distribution of the pseudorotational phase angle P and puckering amplitude vmax of the base steps in contact with hPolα in the binary complex (yellow circles), with hPolα in the ternary complex (gray triangles) and with yPolα in the ternary complex (red squares).

